

Home > Our research topics > The Weather Regimes > Influence of Rossby wave-breaking on the North Atlantic Oscillation.
Jet streams in the upper troposphere usually reach their maximum on the western side of the oceanic basins where the land-sea thermal contrasts are the strongest. East of the same basins, synoptic eddies get larger amplitude and feedback onto the jet streams. This feedback is characterized by the breaking of Rossby waves in the upper troposphere and plays a crucial role in the low-frequency atmospheric variability like the North Atlantic Oscillation (NAO ). Two kinds of wave breaking exist; cyclonic wave-breaking pushing the jet southward and closely linked with the negative phase of the NAO and anticyclonic wave-breaking shifting the jet poleward and favoring the positive phase.
Results of two simulations using a primitive-equations model without topography and humidity are shown in the figure, one reproducing the process involved during the negative phase of the NAO (left column) and the other during the positive phase (right column). In the first case, the temperature gradient is maximum at 30°N, it leads quite systematically to cyclonic wave-breaking, the jet is zonally oriented and is maintained at the same latitude as the forcing (30°N) by the storm-track. In the second case, the temperature gradient is maximum at 45°N, the breaking is essentially anticyclonic, the jet is southwest-northeast oriented, and is strongly displaced poleward where eddies are the strongest and where they feedback the most efficiently. In the future, this type of result could allow to better understand the role played by sea surface temperature anomalies in the general atmospheric circulation.
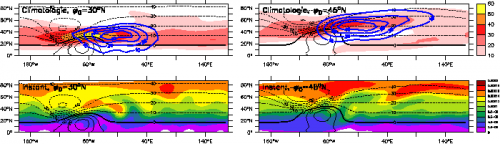
Comparison between two simulations using a dry and aquaplanet version of a primitive-equations model on the sphere in which the temperature is relaxed toward an analytically prescribed field. The latter is composed of a cold anomaly (dashed black contours) located northwest of a warm anomaly (solid black contours) to reproduce the land-sea thermal contrast in winter. The two simulations differ only from the latitude of the restoration-temperature gradient, 30°N (left column) and 45°N (right column). In the upper panels, blue contours and red shadings represent respectively the time average of the high-frequency kinetic energy (interval: 10 m2/s2) and of the zonal wind (interval: 10 m/s) at 200 hPa. In the lower panels, shaded areas show the absolute vorticity at 200 hPa at a given time; on the left, we recognize cyclonic wave-breaking, and on the right anticyclonic wave-breaking.
|