

Accueil > Our research topics > Cyclogenesis study > Critical regions of upper-tropospheric disturbances regeneration
In mid-latitudes, synoptic-scale anomalies appear in the upper troposphere and evolve along the jet streams. These upper-tropospheric anomalies are usually strongly stretched due to the action of the deformation field of the jet along which they evolve leading to a loss of their energy. However, the same anomalies can be temporarily regenerated if they cross the jet. The jet crossing occurs preferentially in specific points along the jet axis, called critical points, as shown by the figure.
In each panel of the figure, the same green triangle appears. It is a remarkable point of the jet and more precisely a saddle point of an important field called effective deformation which is represented by its positive values in red shadings.
Two simulations using a barotropic model on the sphere are compared, one with all the terms (the nonlinear case) and the other with just linear terms (the linear case). In the nonlinear case, the perturbation is first strongly stretched on the south side of the jet, then crosses the jet about the critical point. At that time, the perturbation is characterized by a contraction stage leading to an increase of kinetic energy. In the linear case, the perturbation stays on the south side of the jet, does not cross the jet and keeps stretching leading to a strong loss of kinetic energy. To conclude, the underlined mechanism depends on the combined effects of the effective deformation and nonlinearities and is not related to any linear instability.
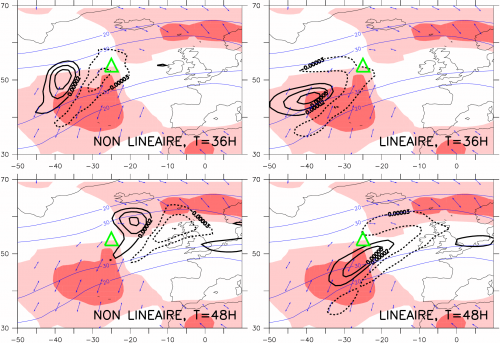
Nonlinear (left) and linear (right) evolution of a synoptic-scale perturbation moving along a jet with a critical point
represented by a green triangle about 25°W, 54°N. Upper and lower panels correspond to 36H and 48H after the initial time.
Blue contours are the jet wind speed isolines (interval : 10 m/s for values greater than 20 m/s). Red shadings, blue arrows and
heavy black isolines represent respectively regions of positive effective deformation (interval : 5e-10 s-2), the dilatation axes and
the perturbation vorticity (interval : 2.5e-4 s-1, dashed and solid contours for negative and positive values).
|