

Home > Our research topics > Ensemble Prediction > Using a model climatology for extreme waves diagnostics
by Bruno Joly
published in the Météo-France 2018 Research Report (ISSN : 2116-4541)
We study the sensitivity of the forecast of strong waves affecting the Atlantic coast of Western Europe, sometimes leading to very significant retreats of the coastline.
When a wave model predicts an event of such intensity, the associated uncertainty must be documented. In this study, we study the behaviour of the Météo-France WAve Model (MFWAM), forced by the 35-member global atmospheric ensemble model PEARP (Ensemble Prediction of the ARPEGE French model : "Action de Recherche Petite Echelle Grande Echelle" which means "Research Action Small Scale Large Scale"). A hindcast database of MFWAM forced by PEARP is available over a 10-year period. Thanks to this reference also called climatology of the model, it is possible to compare the values’ distribution of wave ensemble forecast’s different members with the distribution of the values of the climatology to measure the unusual character of this forecast.
This calculation of the so-called Extreme Forecast Index (EFI) is particularly sensitive to the sampling of the climatology set up. In the case of the Eleanor storm of 2nd January 2018, we show the impact on EFI of two model climatology set up, with two hindcast frequencies, 1 and 4 days, and the addition or not of a record winter 2013-2014.
On the figure below, we can see very high values of EFI calculated for a frequency of 4 days and without the record winter. When the frequency of climatology is increased to 1 day and once winter 2013-2014 is added to the climatology, EFI values are significantly reduced to a ratio of 10%. Highest EFI values are more localized and more relevant in terms of expected impact.
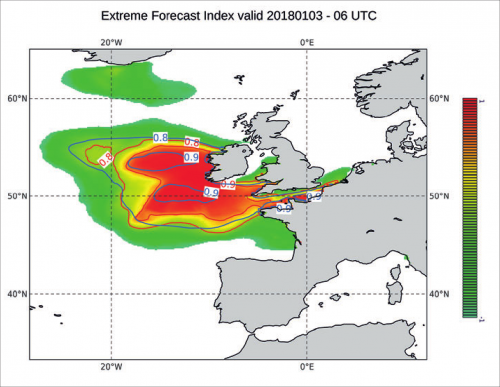
Color shadings show Extreme Forecast Index values (between -1 and 1). Red contours correspond to 0.8 and 0.9 EFI values with a climatology with hindcast every 4 days and without winter 2013-2014. Blue contours show the same EFI values but with a one-day climatology and with winter 2013-2014.
In the case of extreme events, the use of a climatology of a probabilistic model improves the information produced by the forecast, all the more so if we maximize the representativity of this climatology.
|