

Accueil > Our research topics > Cyclogenesis study > Adding the time evolution in a synoptic coherent structures extracting system
As for synoptic scales, the dynamics of depressions can be described through a single field, the potential vorticity, that enables to retrieve all the dynamical fields : wind, geopotential and surface pressure. Two levels are commonly considered as relevant in order to analyse a meteorological situation : one near the top of the atmospheric boundary layer and the tropopause. The methodology employed here consists in detecting and extracting from these two fields coherent structures or anomalies that can be described with a limited number of non-zero coefficients in a wavelet base which is adapted to the geographic position and to the shape of every detected element. All other things being equal, especially the number and the selection of these coefficients, this adjustment is a real improvement in so far as the aspect ratio and orientation of the structures are more realistic. A tracking algorithm, such as those developed for the relative vorticity, is then operated in order to get some information about the life of these structures : where do they come from ? when did they appear ? Even though this tracking only uses information linked with amplitude and position of the structures, and additionally the wind, a complete set of trajectories is obtained, some of the tropopause tracks are longer than ten thousand kilometers.
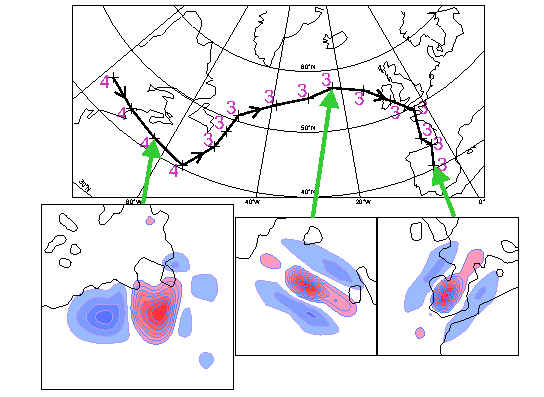
The upper panel shows the trajectory of a structure that has been tracked between the 3rd of January 1989, 06UTC and the 7th of January 1989, 00UTC on the 315K potential vorticity field of the ERA-Interim reanalysis. The number next to the successive positions is the wavelet scale at which the structure has been extracted (the higher this number is the wider the structure is). The three other panels illustrate the extracted structures at different instants (interval : 0.5PVU, positive (resp. negative) values in red (resp. blue)).
|