The ISBA-Ags model: INTRODUCING CO2 ASSIMILATION IN ISBA FOR INTERACTIVE VEGETATION1. INTRODUCTIONThe soil-vegetation-atmosphere transfer (SVAT) schemes now employed in meteorology are designed to describe the basic evaporation processes at the surface together with the water partitionning between vegetation transpiration, drainage, surface runoff and soil moisture change. Recent advances in SVAT modeling consisted in accounting for vegetation- climate-CO2 feedbacks in order to: (1) describe, in a more realistic way, the canopy stomatal conductance by considering the functional relationship between stomatal aperture and photosynthesis (Wong et al. 1979); (2) make the SVATs more general in order to properly simulate the surface processes in contrasting CO2 concentration, air temperature, and air humidity conditions, with the same calibrated model; (3) use the estimated assimilation rate to simulate the plant growth and mortality, and diagnose the leaf area index (LAI) consistently with the prescribed climate and CO2 concentration (Calvet et al. 1998b). The ISBA (Interactions between Soil, Biosphere, and Atmosphere) scheme (Noilhan and Planton 1989) was modified in order to account for the atmospheric carbon dioxide concentration on the stomatal aperture. The physiological stomatal resistance scheme proposed by Jacobs (1994) was employed to describe photosynthesis and its coupling with stomatal resistance at leaf level. In addition, the plant response to soil water stress was accounted for by a normalized soil moisture factor applied to the mesophyll conductance. The computed vegetation net assimilation was used to feed a simple growth submodel, and to predict the density of vegetation cover. Only two parameters are needed to calibrate the growth model: the leaf life expectancy and the effective biomass per unit leaf area. The new scheme, called ISBA-Ags, was tested against data from six micrometeorological databases for vegetation ranging from temperate grassland to tropical forest. 2. datasetsThe datasets used to calibrate the model were all used and described in previous papers: MUREX (Calvet et al. 1998a) is an agricultural fallow in south- western France, PILPS/Cabauw (Chen et al. 1997) is a grassland in the Netherlands, HAPEX-MOBILHY/Caumont (Mahfouf and Noilhan 1996) is a soybean field of south-western France, INRA/Avignon (Olioso et al. 1996) is a late soybean field in south-eastern France, INRA/Castanet (Cabelguenne et al. 1990) is a maize field in south-western France, and ARME (Shuttleworth et al. 1984) is undisturbed Amazon forest in northern Brazil. For all the sites, continuous meteorological data (air temperature and humidity at screen level, atmospheric pressure, precipitation, wind speed, and solar and atmospheric radiation) are available over periods ranging from 2 months to 3 years. Such data constitute the atmospheric forcing employed to run the SVAT models. However, the CO2 concentration was not measured in any of these experiments. In this study, a value of 340 ppm at screen level was assumed. Since the purpose of this study is to validate models of both hydrological and physiological processes, most appropriate datasets should comprise measurements or estimates of soil moisture in the root- zone (w2), evapotranspiration (LE) and heat surface fluxes, net assimilation of CO2 (An), and leaf area index (LAI). Only one dataset provides observations of the four model output variables: INRA/Avignon (Olioso et al. 1996). Evapotranspiration could be estimated in all the datasets, except over the maize of Castanet. Root-zone soil moisture was not fully characterized during PILPS- Cabauw and ARME. But in both cases, severe soil water stress are not likely to occur, because of the rather large amount of precipitation and also, as far as the Amazon forest is concerned, because of the deep root-zone. The leaf area index was either directly measured or estimated. The MUREX fallow was cut in 1995 at the end of the spring growth. The resulting reduction of LAI was prescribed in ISBA-Ags. The other agricultural canopies were grown in optimal conditions by providing the required tillage, irrigation water amount, nitrogen fertilization, and pesticide application. The irrigation amount was included in the precipitation of the SVAT forcing file. 3. THE COUPLED MODEL3.1 At leaf levelThe purpose of the Jacobs' Ags model is to simulate the leaf net assimilation of CO2, An, and the associated leaf conductance to water vapour gs, as a function of air density ra, concentration of CO2 at the leaf surface Cs, leaf temperature Ts, saturation deficit at the leaf surface Ds (g kg-1), global radiation Rg (W m-2), and plant type (C3 or C4). The saturation deficit Ds represents the difference between the saturation specific humidity at leaf temperature and the air specific humidity close to the leaf surface. Along with An and gs, the Jacobs' model computes the leaf internal CO2 concentration (Ci). The stomatal conductance is estimated using a flux-gradient relationship, modified to account for the effect of Ds on stomatal aperture. It was necessary to modify the Jacobs' model in order to introduce a response to soil water stress. The soil water stress effect was applied to the mesophyll conductance (the only tunable parameter of the Ags model). In this version of the Ags model, gm is multiplied by the normalized soil moisture theta2, also employed in the standard version of ISBA to represent the soil water stress:
where w2 is the soil volumetric moisture in the root- zone, and wfc and wwilt are the root-zone moisture content at field capacity and wilting point, respectively. In seasonal simulations, w2 is a value predicted by ISBA. 3.2 From the leaf to the canopyThe leaf conductance and CO2 assimilation are not homogeneous within the canopy because of the factors acting on photosynthesis: the photosynthetically active radiation (PAR) is attenuated by the vegetation; also, the leaf temperature and the air CO2 concentration and saturation deficit may vary within the canopy. It is assumed that the input variables of the physiological model Ts, Cs, and Ds do not vary in the vegetation canopy layer together with the parameters of the Jacobs' model. In the coupled model, Ts is the surface temperature calculated from the resolution of the surface energy balance, similar to the standard version of ISBA. The Cs and Ds variables at canopy level are obtained from their values at reference level from a simple flux-gradient relationship by using the aerodynamic resistance ra computed by ISBA and the CO2 and water vapour fluxes of the previous time step. The PAR extinction by the canopy is described in the model. Assuming an homogeneous leaf vertical distribution, the integrated canopy net assimilation AnI and conductance gsI can be written:
where h is canopy height and z is the distance to the ground. Variability in Eqs. (2) and (3) is assumed to be due to the light levels only. Possible air temperature and humidity differences within the canopy are not accounted for. Finally, the canopy conductance gsI (the driving factor of transpiration), is employed in the standard algorithm of ISBA to compute the heat and water vapour surface fluxes. 3.3 Growth and mortalityGrowth may be described as the accumulation of carbon obtained from the atmospheric CO2 assimilation, and senescence as the result of a deficit of photosynthesis (due to external factors). In this study, the bulk biomass B (kg m-2) is obtained from a differential equation:
In the growth increment term of Eq. (4), PC is the proportion of carbon in the dry plant biomass (a constant value of 40% is assumed) and MC and MCO2 are the molecular weights of carbon and CO2 (12 and 44 g mol-1), respectively. The mortality increment term of Eq. (4) represents an exponential extinction of B characterized by a time-dependent effective life expectancy:
where tauM is the maximum effective life expectancy, Anfm(t) the maximum leaf net assimilation reached on the day before time t and An,max the optimum leaf net assimilation. The optimum leaf net assimilation An,max is a constant. It corresponds to the leaf net assimilation given by the Jacobs' model with optimal input values: Ds = 0 g kg-1, Ia(h) = 500 W m-2, Ts = 25 C for C3 plants and Ts = 35 C for C4 plants. The value of LAI is obtained from B by assuming that for a given vegetation canopy, the ratio between B and LAI is a constant: alpha. Therefore, LAI is given by:
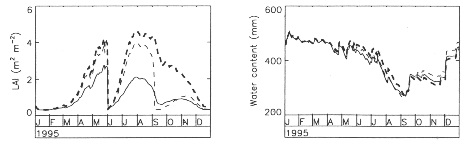
Only two parameters, the alpha ratio and tauM have to be determined for each canopy type from LAI measurements or estimations. These vegetation parameters have to be retrieved during the model calibration, together with the mesophyll conductance gm. 4. CALIBRATIONThe estimated values of the plant parameters are presented in Table 1. The obtained values are rather disparate, and correspond to different plant- development strategies. In the studied datasets, the highest obtained values of a correspond to evergreen, strongly rooted canopies (fallow, grassland, Amazon forest). Also, the Amazon forest exhibits the lowest value of gm, associated with the highest value of tauM: the high leaf life span compensates for the low biomass production per leaf area unit, and contributes to maintain a stable, nearly constant value of LAI. Unlike the plants considered before, both soybean crops (late and precocious cultivars of INRA/Avignon and HAPEX- Mobilhy/Caumont, respectively) show low alpha values. This characteristic corresponds to their rapid life cycle (2 and 5 months, respectively): the production of leaves is favoured, and the growing cycle can be completed rapidly in spite of low values of gm. The late cultivar presents a lower value of alpha and (especially) of tauM than the precocious one, consistent with its shorter growing cycle. 5. MODEL VALIDATIONThe ISBA-Ags model computes the surface fluxes, including net assimilation, and the leaf area index LAI. Once calibrated over a given canopy, it may be assumed that the plant growth parameters (alpha and tauM) and mesophyll conductance gm at 25 C are intrinsic plant characteristics, which remain unaffected by changes in the climatic forcing. This hypothesis was tested by running ISBA-Ags over the 1996 growing cycle of the MUREX fallow (for the calibration, 1995 MUREX data were employed). In 1996, the MUREX vegetation was not cut, and the precipitation regime was more favourable to plant growth (a precipitation total of 860 mm was registered in 1996, against 770 mm in 1995). The simulated LAI and w2 are presented in Fig. 1 for the two years, together with the available observations. Both variables are properly simulated. The obtained results confirm that once calibrated, the ISBA-Ags model is able to simulate the main vegetation responses to changes in the atmospheric conditions, and that it represents a rather robust approach.
6. SENSITIVITY TO CO2CONCENTRATIONFrom the water balance viewpoint, an increase in [CO2] has two immediate conflicting effects: (1) LAI may increase because of the photosynthesis enhancement (at least for C3 plants); (2) the leaf conductance decreases. The first effect tends to increase transpiration, and the second effect tends to decrease transpiration. Therefore, the resulting change in evapotranspiration and soil moisture may be totally different from one plant type to another, for given climate conditions. Also, there is a third effect related to the feedback beetween transpiration and w2: changes in transpiration affect soil moisture availability. This effect occurs over longer periods of time and may trigger seasonal differences in the resulting water balance change. Such a feedback is accounted for in ISBA-Ags. Fig. 2 presents a comparison between LAI and w2 computed by ISBA-Ags in the case of MUREX-95 under different prescribed values of [CO2]. Despite a rather strong LAI response to CO2 enrichment the simulated soil moisture seldom departs from its reference value, because stomatal closure limits the LAI increase effect on transpiration. 7. CONCLUSIONThe ISBA-Ags model presented in this study seems to be a good tool to analyse the plant response to climate change. Although the model uses a limited number of parameters, it is able to depict very distinct situations. The main advances of ISBA-Ags in relation to the standard version of ISBA are: (1) a more realistic representation of the leaf conductance; (2) a better integration to the canopy scale by using a (simple) radiative transfer parameterization; (3) a climate- derived leaf area index may now contribute to better account for the biological control of evapotranspiration; (4) the new scheme may be validated through the computed net assimilation by using in situ measurements of the CO2 flux; (5) the complex phenomena associated with an increase of the atmospheric concentration of CO2 may possibly be accounted for. 8. REFERENCESCabelguenne, M., Jones, C.A., Marty, J.R., Dyke, P.T. and Williams, J.R., 1990. Calibration and validation of EPIC for crop rotations in southern France. Agricultural Systems, 33, 153-171. Calvet, J.-C., Noilhan, J. and Bessemoulin, P., 1998a. Retrieving the root-zone soil moisture from surface soil moisture or temperature estimates: A feasibility study based on field measurements. J. Appl. Meteor., 37(4), 371-386. Calvet, J.-C., Noilhan, J., Roujean, J.-L., Bessemoulin, P., Cabelguenne, M., et al. 1998b. An interactive vegetation SVAT model tested against data from six contrasting sites. Agric. For. Meteorol., 92, 73-95. Chen, T.H., Henderson-Sellers, A., Milly, P.C.D., Pit- man, A.J., Beljaars, A.C.M. et al., 1997. Cabauw experimental results from the project for intercom- parison of land-surface parameterization schemes. J. Climate, 10(7), 1194-1215. Jacobs, C.M.J., 1994. Direct impact of atmospheric CO2 enrichment on regional transpiration. Ph.D. Thesis. Agricultural University, Wageningen, 179 pp. Mahfouf, J.-F. and Noilhan, J., 1996. Inclusion of gravitational drainage in a land surface scheme based on the force restore method. J. Appl. Meteor., 35(6), 987-992. Noilhan, J. and Planton, S., 1989. A simple parameteri- zation of land surface processes for meteorological models. Mon. Wea. Rev., 117, 536-549. Olioso, A., Carlson, T.N., and Brisson, N., 1996. Simulation of diurnal transpiration and photosynthesis of a water stressed soybean crop. Agric. For. Meteorol., 81, 41-59. Shuttleworth, W.J., Gash, J.H.C., Lloyd, C.R., Moore, C.J., Roberts, J., et al., 1984. Eddy correlation measurements in Amazon forest. Quart. J. Roy. Meteor. Soc., 110, 1143-1162. Wong, S.C., Cowan, I.R. and Farquhar, G.D., 1979. Stomatal conductance correlates with photosynthetic capacity. Nature, 282, 424-426. FIGURES
|