Spectral filtering and (DCT) variance spectrum
Here we want to compare some fields’ spectra:
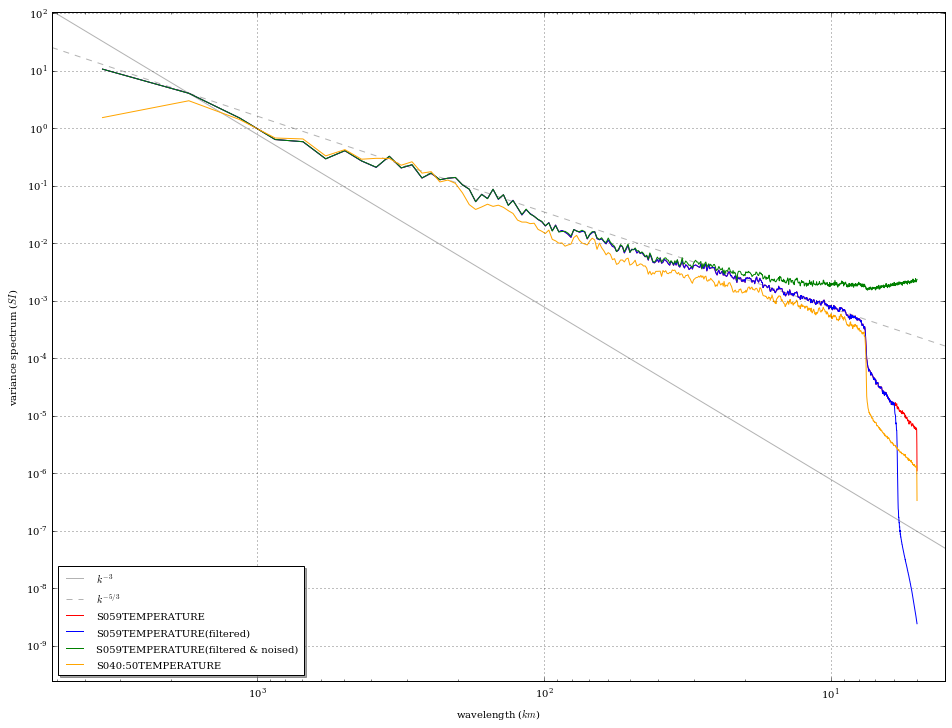
- a raw field from an AROME simulation
- the same field, filtered with a spectral round-trip at a lower truncation
- the filtered field, to which we have added a white noise
- the average spectrum of fields on the surrounding vertical levels (40:50)
[1]:
%matplotlib inline
import numpy
import epygram
epygram.init_env()
[2]:
r = epygram.formats.resource('../inputs/ICMSHAROM+0001', 'a')
[3]:
t59 = r.readfield('S059TEMPERATURE')
t59.sp2gp()
sp59 = t59.dctspectrum()
sp59.name = t59.fid['FA']
[4]:
# spectral filtering
trunc_spgeom = r.spectral_geometry.deepcopy()  # a spectral geometry is attached to a FA resource
print(trunc_spgeom.truncation['in_X'], trunc_spgeom.truncation['in_Y'])
trunc_spgeom.truncation['in_X'] = 320
trunc_spgeom.truncation['in_Y'] = 300
# spectral roundtrip
t59.gp2sp(trunc_spgeom)
t59.sp2gp()
sp59f = t59.dctspectrum()
sp59f.name = sp59.name + '(filtered)'
(374, 359)
[5]:
# add a white noise
noise = numpy.random.normal(0, size=t59.data.shape)
t59.setdata(t59.data + noise)
[6]:
sp59fn = t59.dctspectrum()
sp59fn.name = sp59.name + '(filtered & noised)'
[7]:
spectra = []
for i in range(40,51):
    t = r.readfield('S0{}TEMPERATURE'.format(i))
    t.sp2gp()
    sp = t.dctspectrum()
    sp.name = t.fid['FA']
    spectra.append(sp)
[8]:
sp_ave = spectra.pop(0)
for sp in spectra:
    sp_ave += sp
sp_ave /= len(spectra)
sp_ave.name = 'S040:50TEMPERATURE'
[9]:
epygram.spectra.plotspectra([sp59, sp59f, sp59fn, sp_ave])
[9]:
(<matplotlib.figure.Figure at 0x7fa238a3c410>,
 <matplotlib.axes._subplots.AxesSubplot at 0x7fa2380971d0>)
And finally let’s get a 3rd field, truncated, with some noise added on…
[10]:
# and write back the field to the file
t59.fid['FA'] = 'S059TEMP_NOISED'
r.writefield(t59)