
CNRM-ESM2-1 model
Description
![]() CNRM-ESM2-1 is the Earth system model of CNRM of second generation as developped by the CNRM/CERFACS modelling group. It derives from the physical-dynamical core of the ocean-atmosphere coupled climate model CNRM-CM6-1. CNRM-ESM2-1 accounts for a range of couplings, between ‘physical’ and ‘Earth system (ES)’ components. As shown in Figure 1, these latter are enabled by the inclusion of interactive atmospheric chemistry (REPROBUS) and aerosols (TACTIC) as well as interactive land and ocean carbon cycles (ISBA-CTRIP and PISCES, respectively). More details here
CNRM-ESM2-1 is the Earth system model of CNRM of second generation as developped by the CNRM/CERFACS modelling group. It derives from the physical-dynamical core of the ocean-atmosphere coupled climate model CNRM-CM6-1. CNRM-ESM2-1 accounts for a range of couplings, between ‘physical’ and ‘Earth system (ES)’ components. As shown in Figure 1, these latter are enabled by the inclusion of interactive atmospheric chemistry (REPROBUS) and aerosols (TACTIC) as well as interactive land and ocean carbon cycles (ISBA-CTRIP and PISCES, respectively). More details here
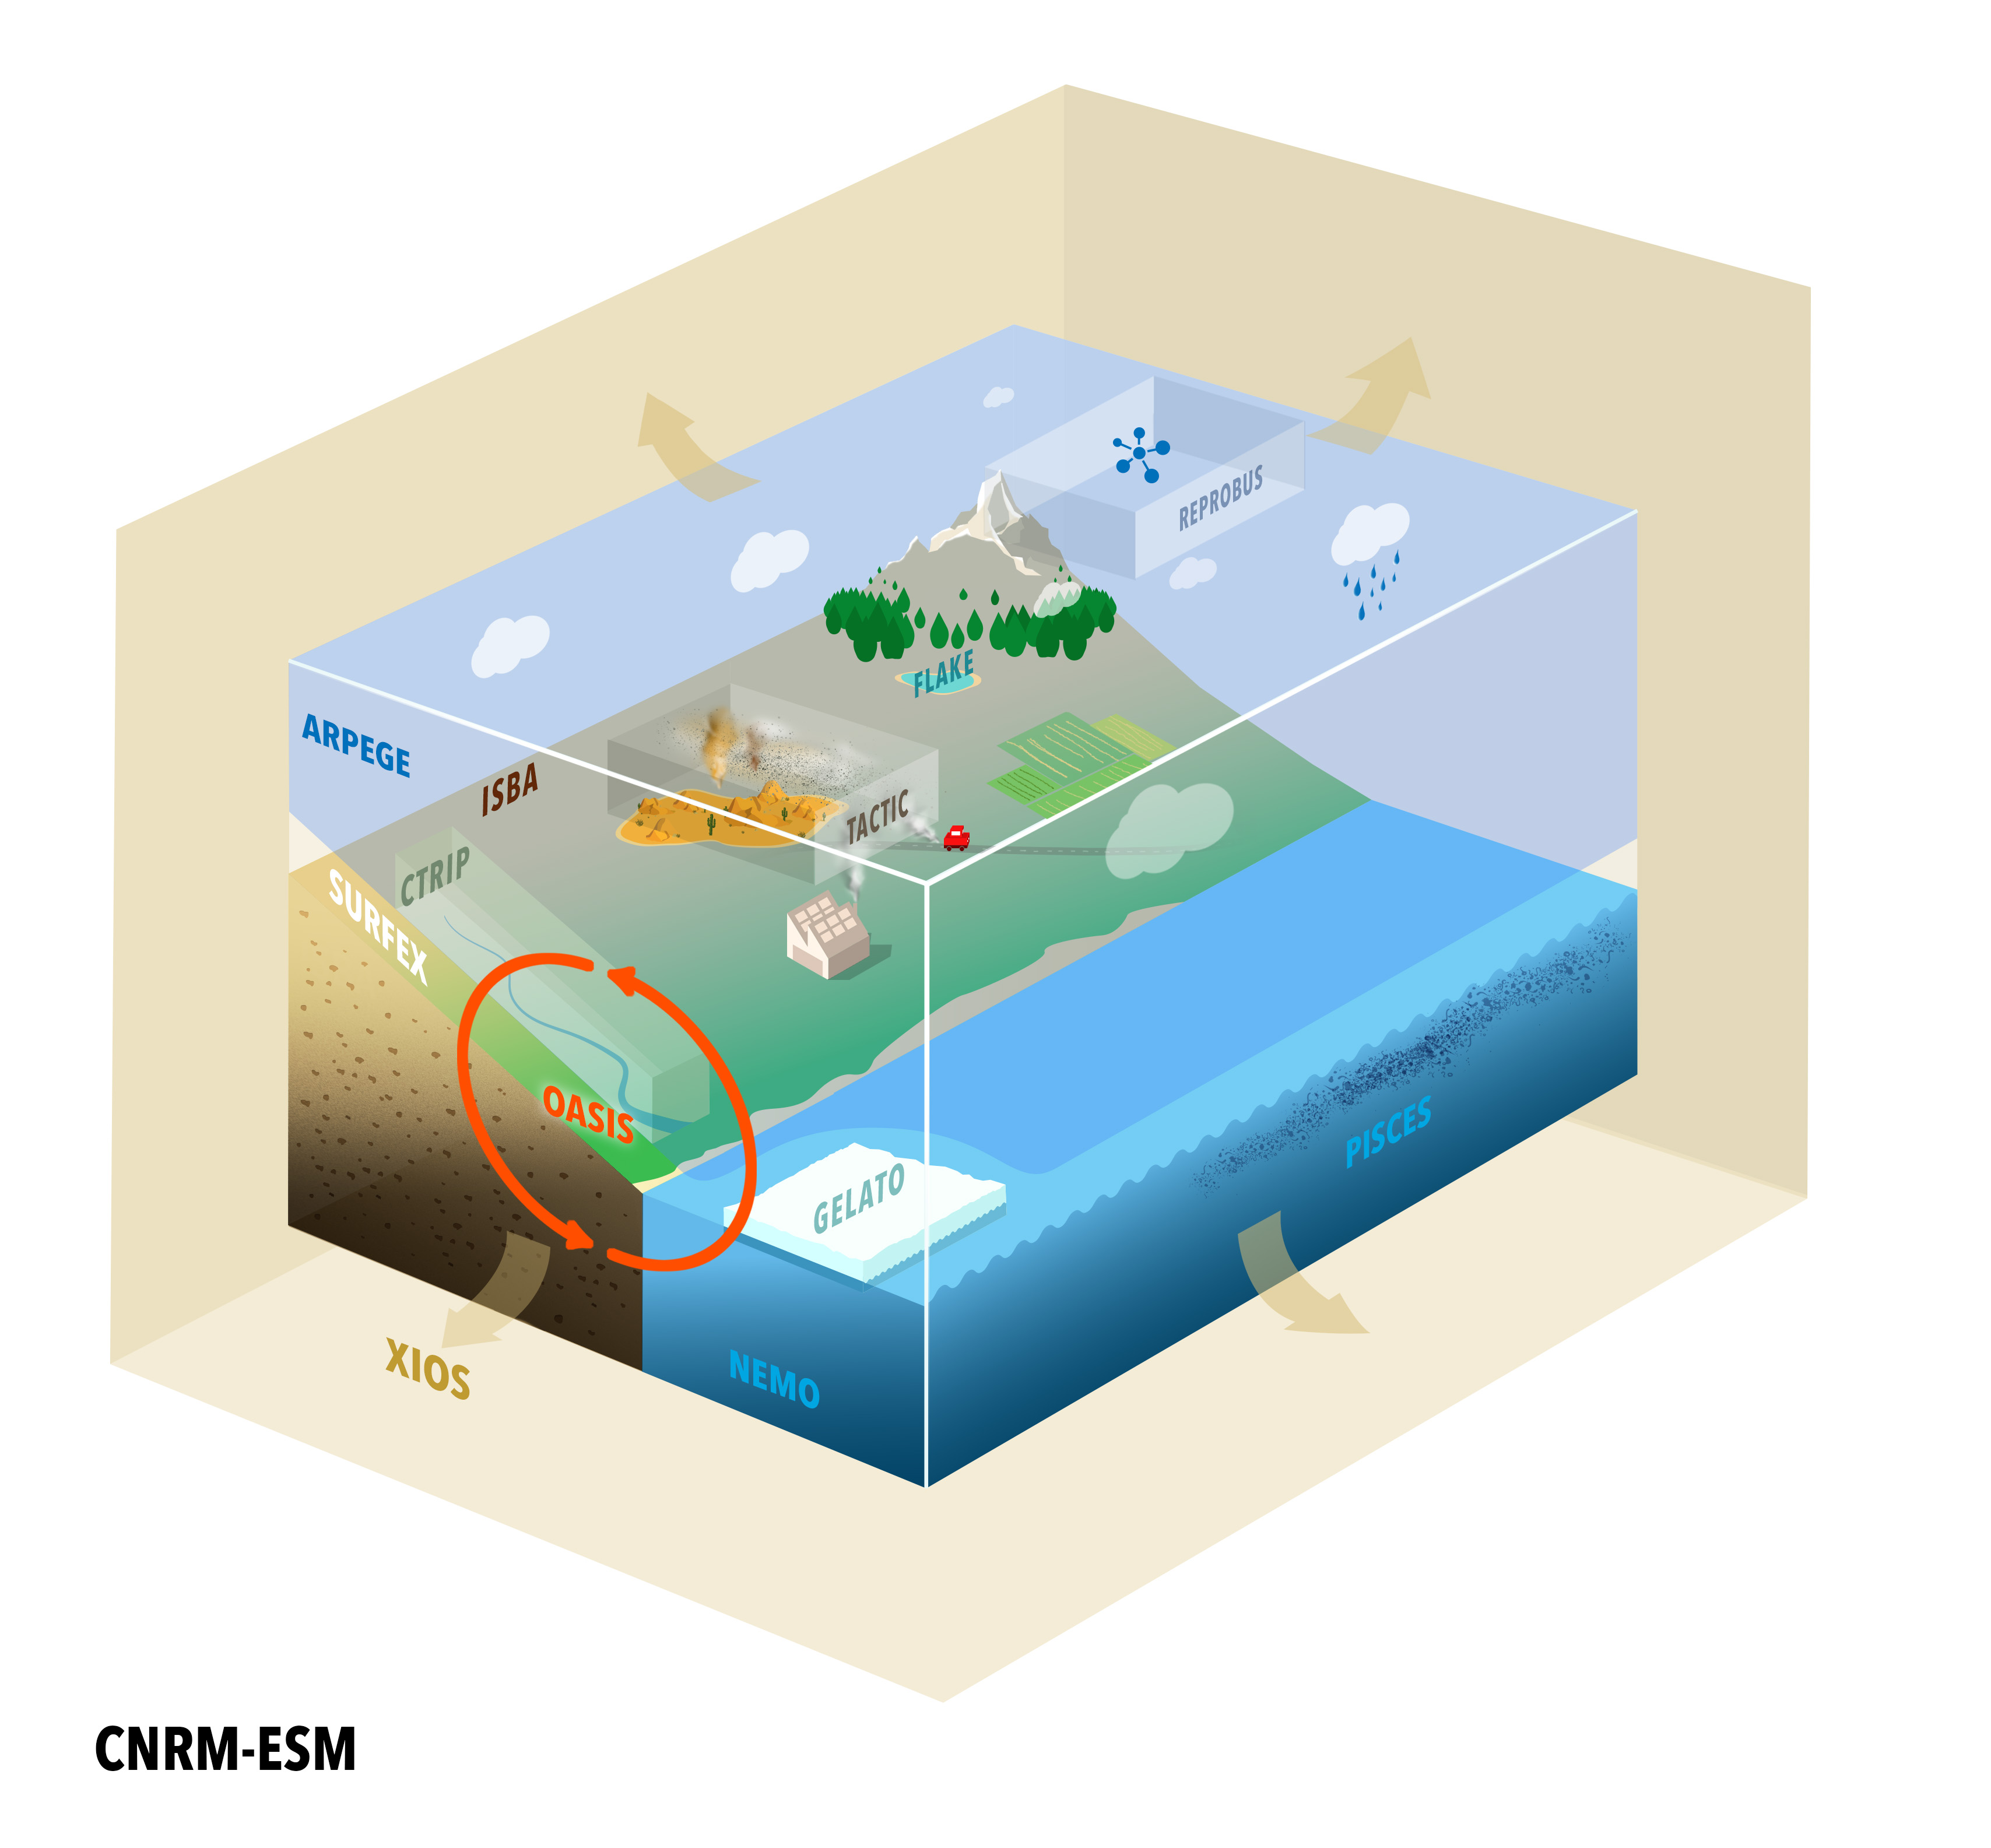
- Figure 1: Schematic of CNRM-ESM2-1 components
![]() CNRM-ESM2-1 provides a first attempt to bound the global carbon cycle by resolving the exchange of carbon not only between the atmosphere, land and ocean but also between land and ocean though the aquatic continuum as simulated by ISBA-CTRIP. As a consequence, CNRM-ESM2-1 can be run either with prescribed atmospheric CO2 concentrations or with anthropogenic CO2 emissions. The other important couplings include for example the dependance of dust emissions (TACTIC) to land cover change (ISBA-CTRIP), influencing the aerosols and radiation processes in the atmosphere. Finally, atmospheric concentrations of key greenhouse gases such as ozone or methane are simulated by REPROBUS in CNRM-ESM2-1 are coupled with the model radiation parameterization. These couplings increase the realism (and degrees of freedom) of the model, which allows to further investigate the role of Earth system feedbacks in future climate projections.
CNRM-ESM2-1 provides a first attempt to bound the global carbon cycle by resolving the exchange of carbon not only between the atmosphere, land and ocean but also between land and ocean though the aquatic continuum as simulated by ISBA-CTRIP. As a consequence, CNRM-ESM2-1 can be run either with prescribed atmospheric CO2 concentrations or with anthropogenic CO2 emissions. The other important couplings include for example the dependance of dust emissions (TACTIC) to land cover change (ISBA-CTRIP), influencing the aerosols and radiation processes in the atmosphere. Finally, atmospheric concentrations of key greenhouse gases such as ozone or methane are simulated by REPROBUS in CNRM-ESM2-1 are coupled with the model radiation parameterization. These couplings increase the realism (and degrees of freedom) of the model, which allows to further investigate the role of Earth system feedbacks in future climate projections.
![]() Results from CNRM-ESM2-1 will serve several model intercomparison projects of CMIP6, in particular C4MIP, LUMIP, GeoMIP and ScenarioMIP. The forthcoming paper of Séférian et al. (in prep) details the modelling setup use for CMIP6 (including the use of recommended forcing and the spin-up strategy) and evaluates the performance of CNRM-ESM2-1 with respect to CNRM-CM6-1.
Results from CNRM-ESM2-1 will serve several model intercomparison projects of CMIP6, in particular C4MIP, LUMIP, GeoMIP and ScenarioMIP. The forthcoming paper of Séférian et al. (in prep) details the modelling setup use for CMIP6 (including the use of recommended forcing and the spin-up strategy) and evaluates the performance of CNRM-ESM2-1 with respect to CNRM-CM6-1.
![]() In the following set of Figures provide a brief overview of CNRM-ESM2-1’s performance with respect to those of the CNRM’s Earth system model of first generation (CNRM-ESM1, Séférian et al. 2016).
In the following set of Figures provide a brief overview of CNRM-ESM2-1’s performance with respect to those of the CNRM’s Earth system model of first generation (CNRM-ESM1, Séférian et al. 2016).
Overview of CNRM-ESM2-1’s performance
![]() Modern carbon cycle mean-state
Modern carbon cycle mean-state
- Figure 2 illustrates the simulated global carbon cycle in the CNRM-ESM2-1 CMIP6 historical simulation against modern observations.
- This figure shows that simulated carbon fluxes has been improved over the historical period in CNRM-ESM2-1 with respect to CNRM-ESM1. However, the model still underestimates land carbon uptake of the tropics because of a deficit in precipitation in this domains.
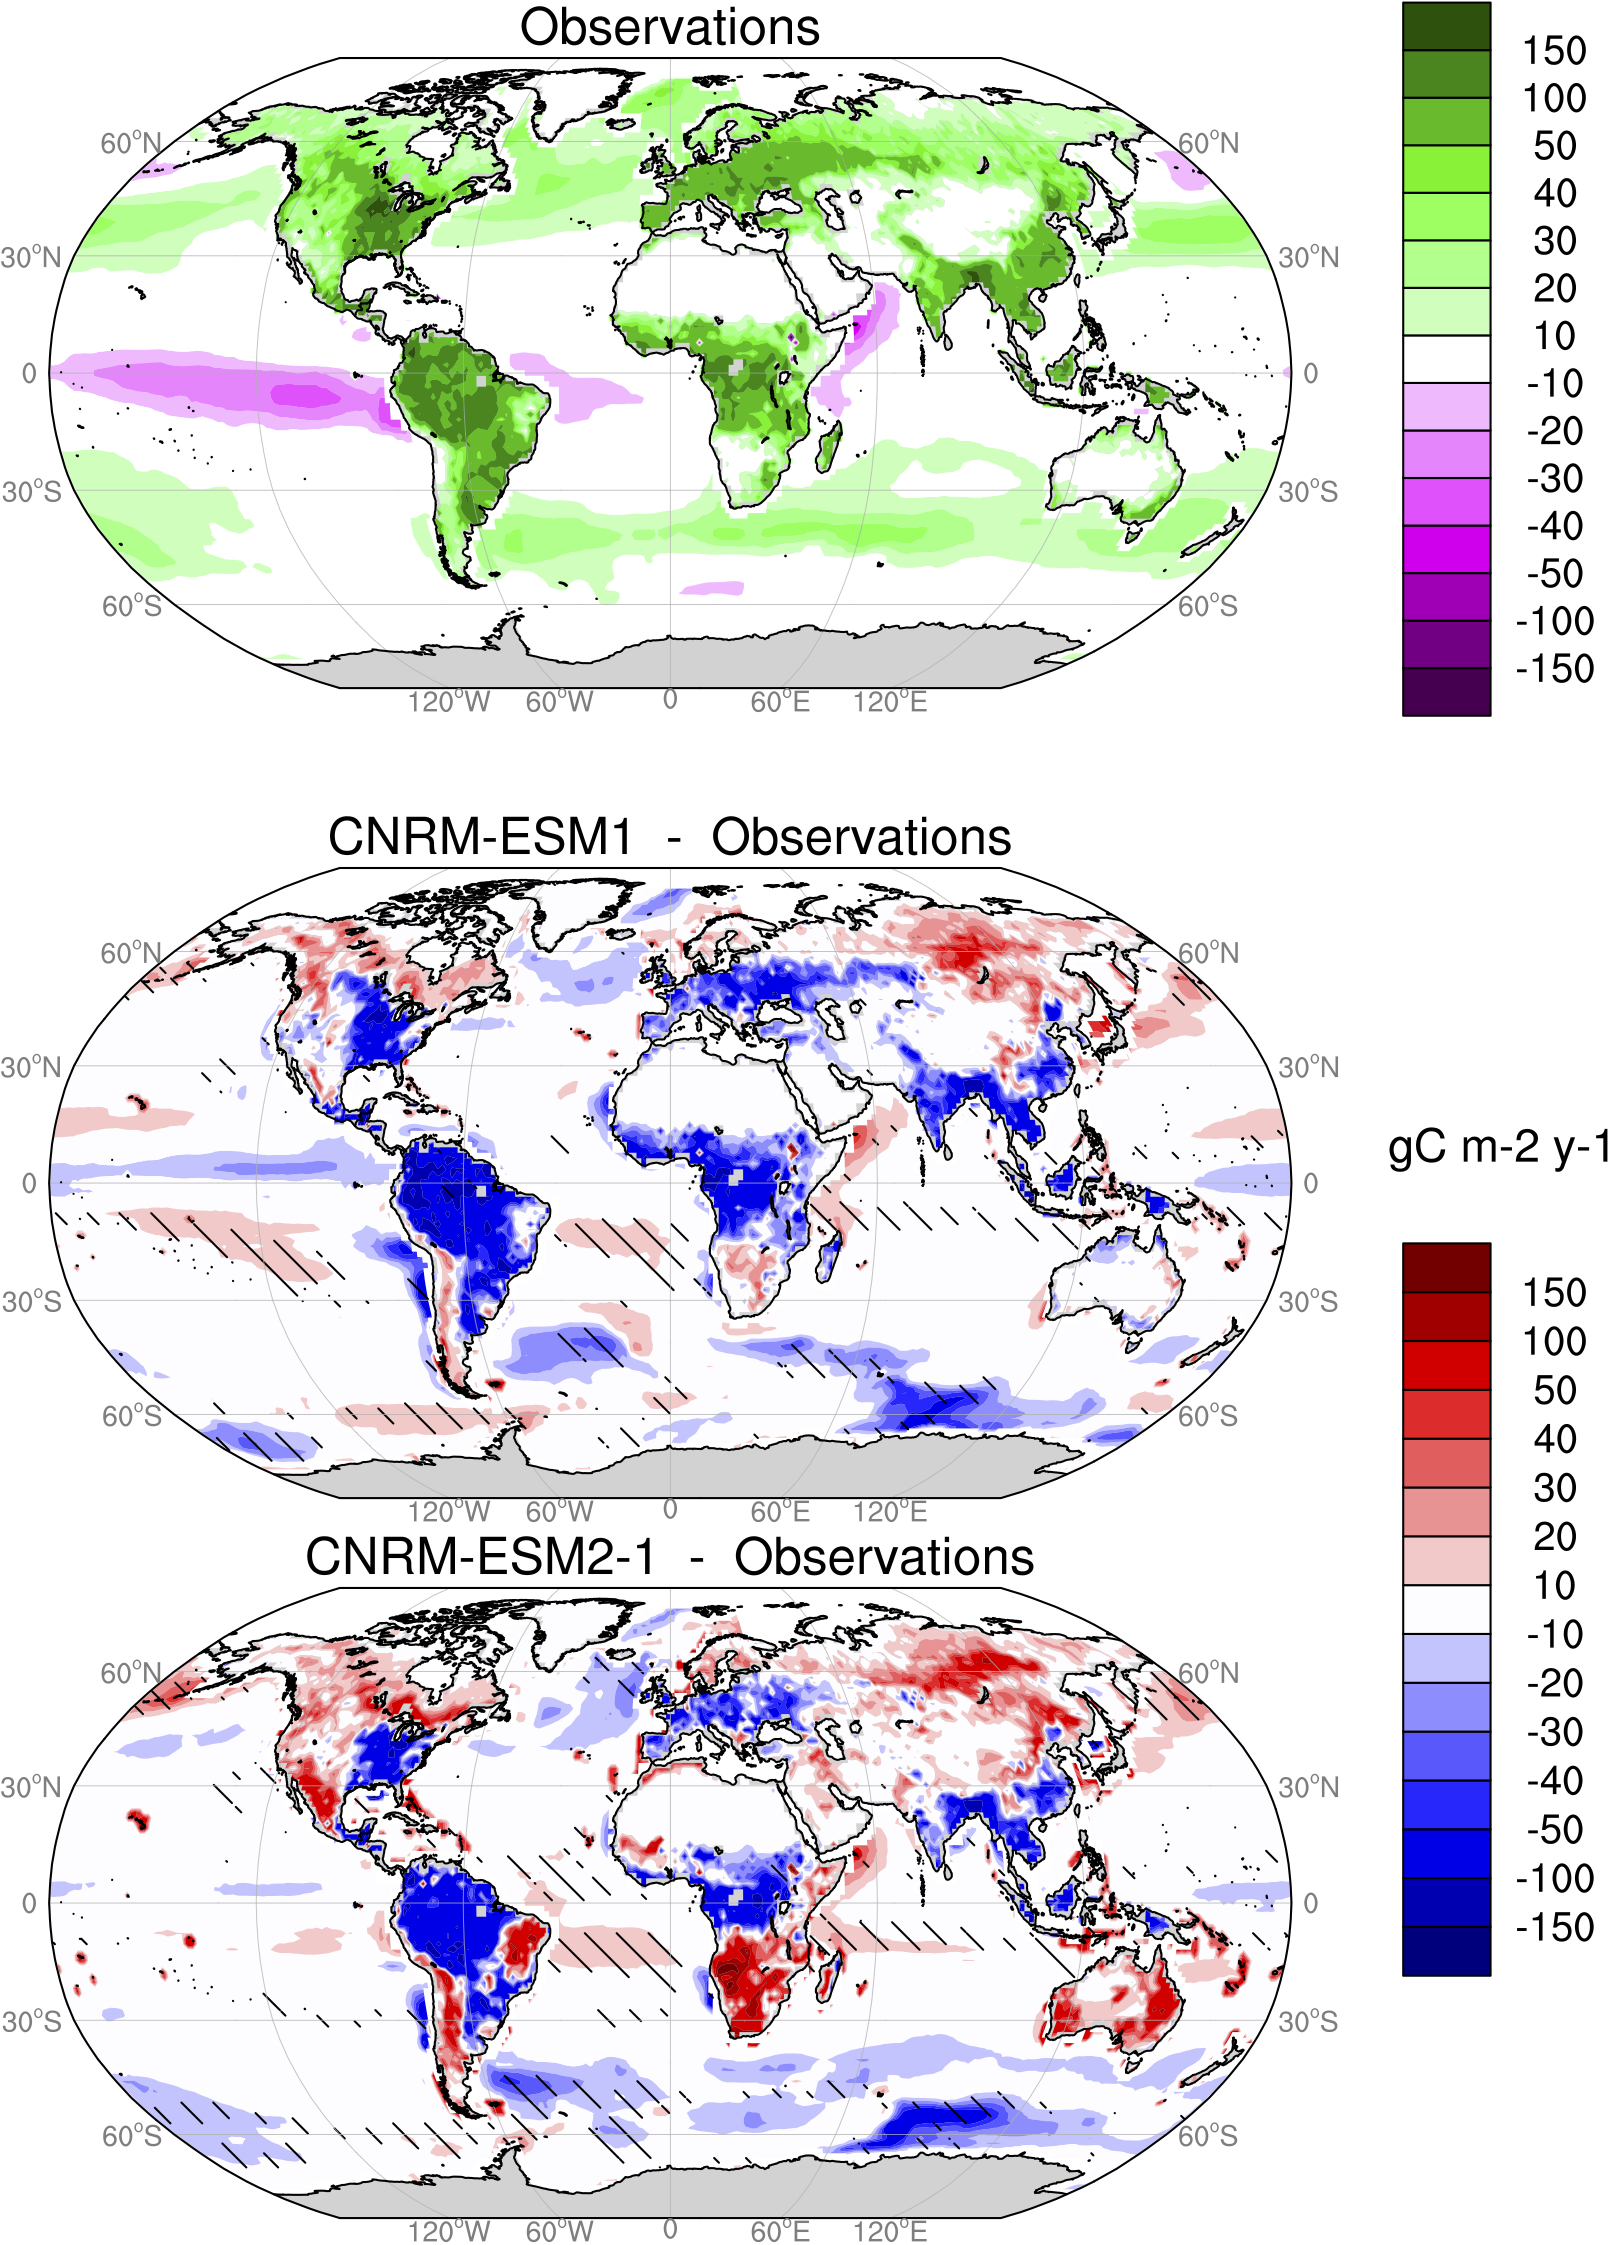
- Figure 2: Land and ocean carbon sink in average over 1986-2005 for (a) observations (combination of the MsT-MIP model average over land (Huntzinger et al., 2018) and the neural network dataproduct over ocean (Landschützer et al. 2016)) and the departure from observed values as simulated by (b) CNRM-ESM1 and (c) CNRM-ESM2-1. Light gray shading in the middle panel indicates missing data. Hatching in the bottom panel indicates disagreement in sign of the carbon fluxes between model and observations.
![]() Climate sensitivity
Climate sensitivity
- The climate sensitivity is an emergent properties of the climate system to rising atmospheric CO2. This metrics is widely used to characterize the model response to rising atmospheric CO2. Gregory et al. (2004) proposed a method to estimate the Equilibrium Climate Sensitivity (ECS) of a model to a quadrupling of CO2 (abrupt-4xCO2 of CMIP-DECK). This method regresses the net TOA radiative flux (∆N) perturbation at the time of CO2 quadrupling against the global mean surface temperature change (∆T).
- When applying Gregory et al. (2004) methodology, Figure 3 shows that the climate sensitivity at equilibrium (ECS) as simulated by CNRM-ESM2-1 is 47% stronger than that of CNRM-ESM1. This results is consistent with CNRM-CM6-1 behaviour in response to a quadrupling of CO2.
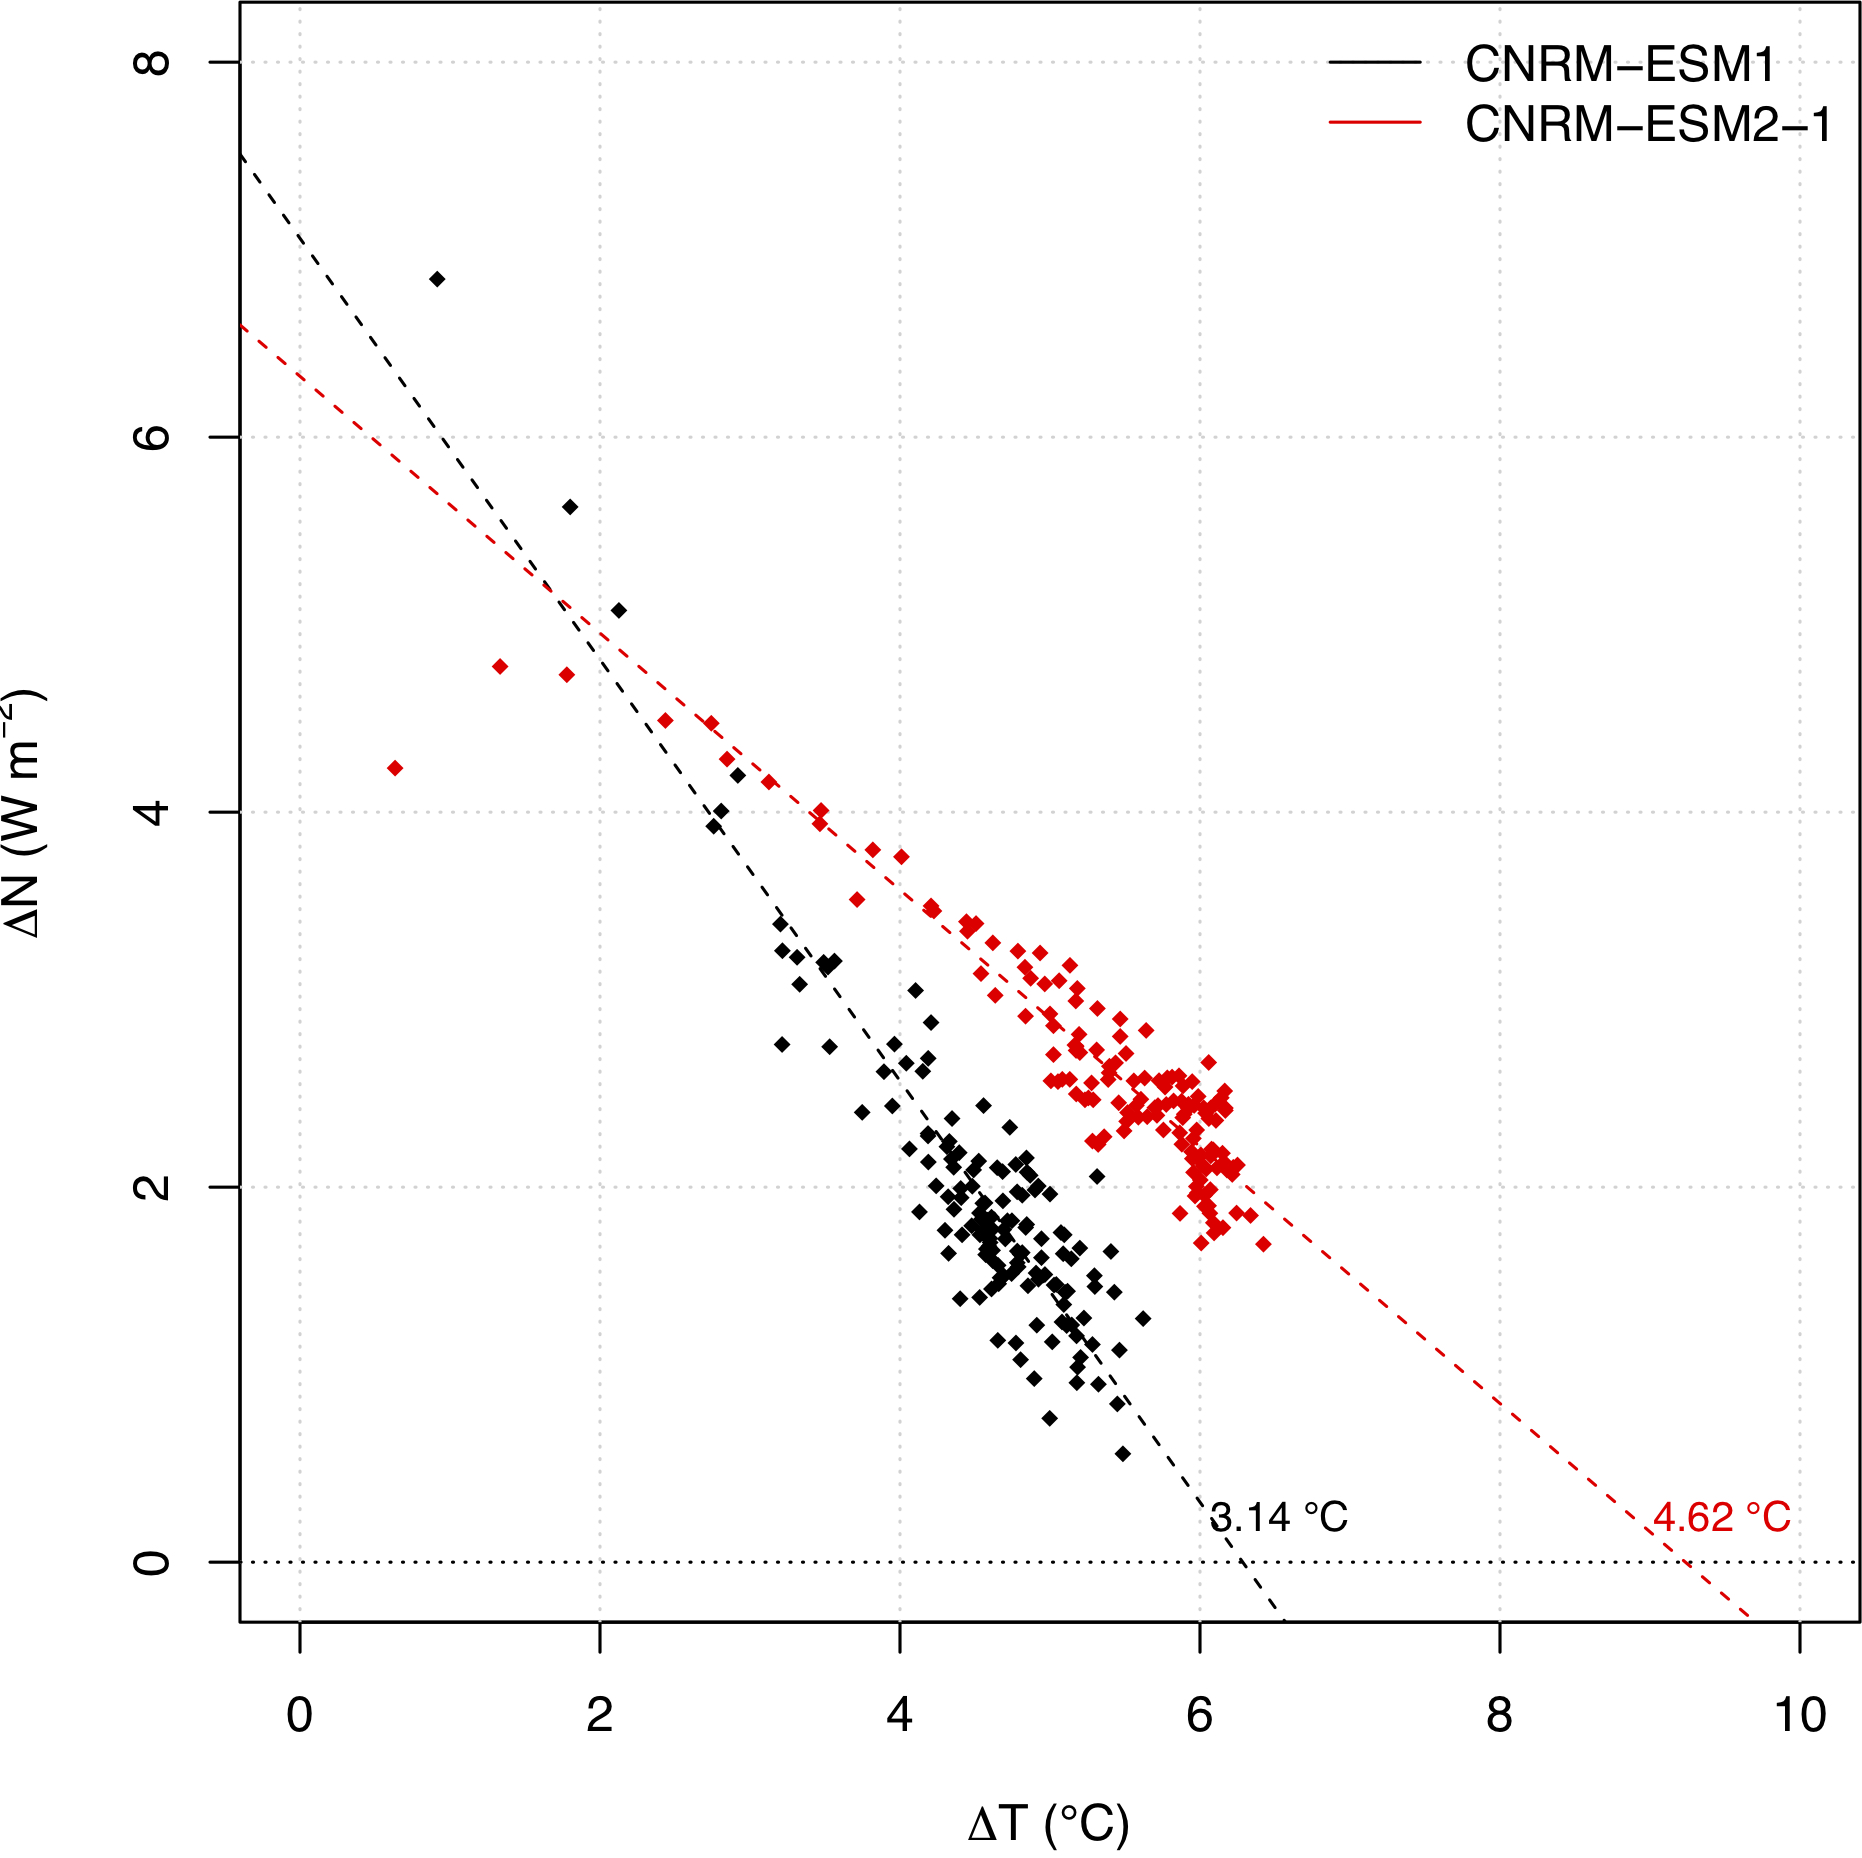
- Figure 3: Relationships between the change in net top-of-atmosphere radiative flux, ∆N, and global-mean surface-air-temperature change, ∆T, after an instantaneous quadrupling of CO2 for CNRM-ESM1 (black) and CNRM-ESM2-1 (red). Data points are global-annual-means. Lines represent ordinary least squares regression fits to 140 years of data. The intercept at N = 0 gives the equilibrium ∆T. The equilibrium climate sensitivity at 2xCO2 is then deduced from the equilibrium ∆T.
- This tends to contradict several studies showing that observed warming points towards low ECS (e.g., Knutti et al., 2017). However, there is a strong indication (not yet published) that a number of other CMIP6 models will have ECS values higher than the upper end of the CMIP5 range.
- Yet, the transient climate response (TCR) as estimated from the 1% rise atmospheric CO2 (1pctCO2 of CMIP-DECK) is similar between both models (Figure 4). It lies within the range of CMIP5 estimates (Randall et al. 2007).
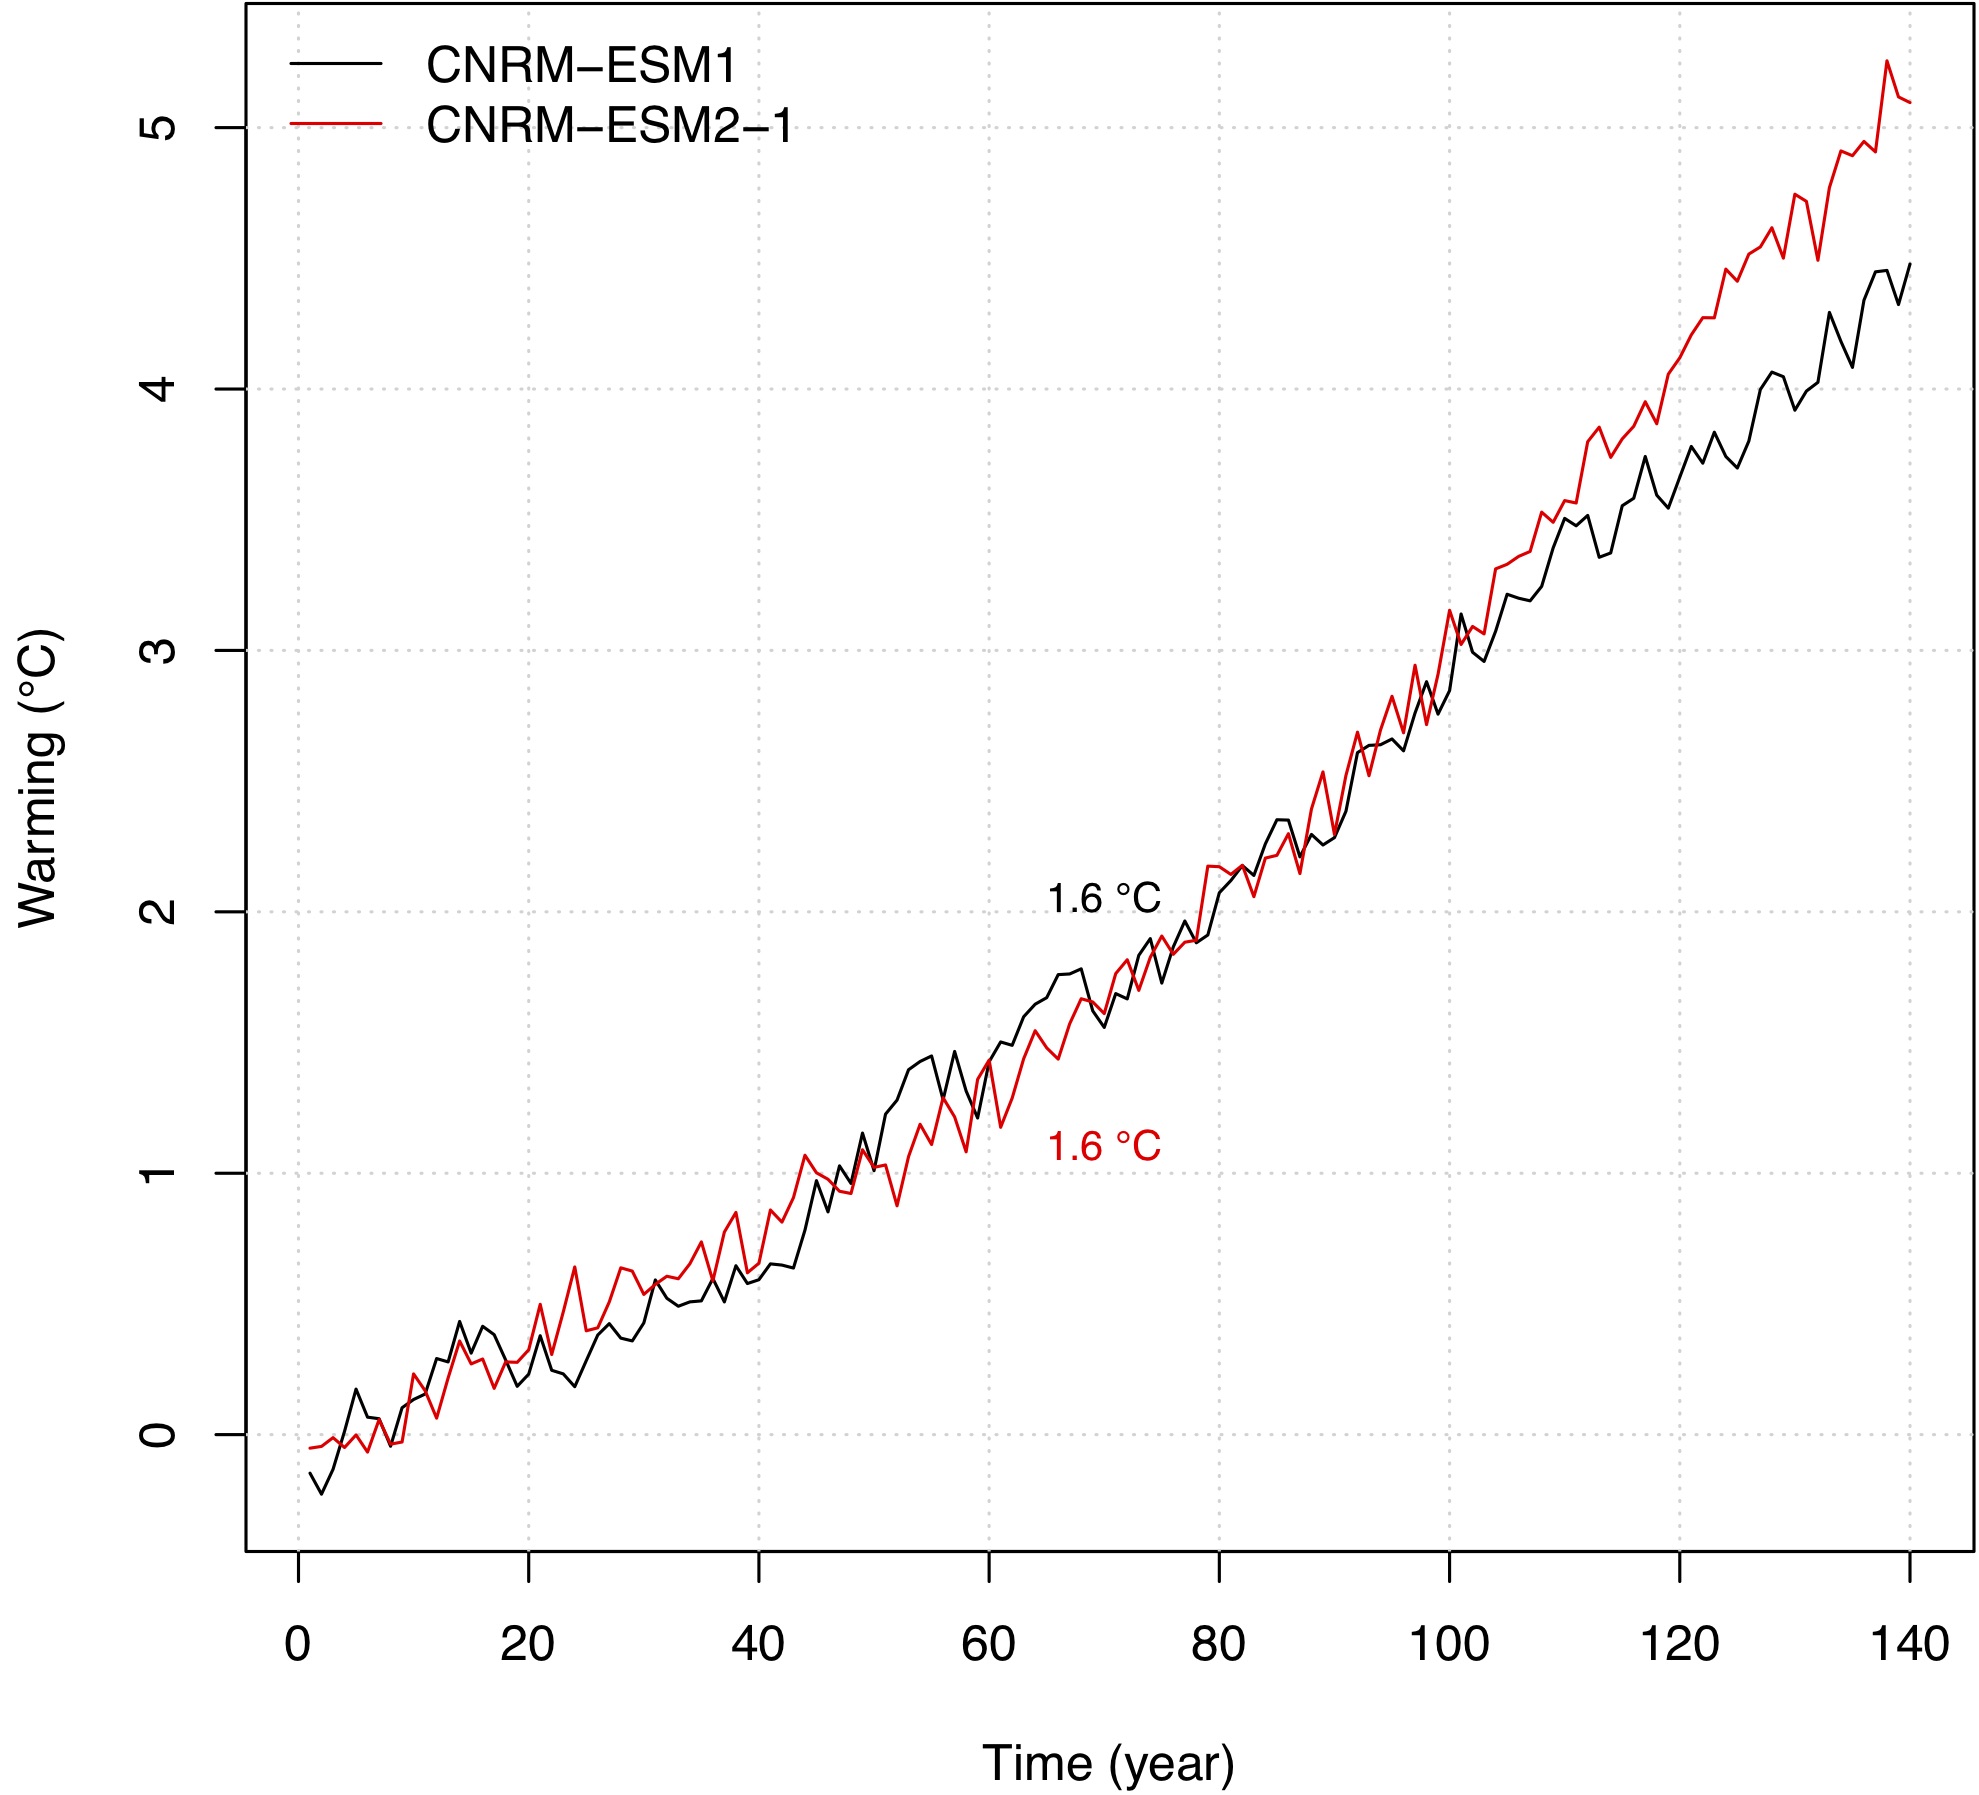
- Figure 4: Global mean warming response in the 1pctCO2 experiment for CNRM-ESM1 (black) and CNRM-ESM2-1 (red). The transient climate response (TCR) is estimated as Flato et al. (2013), that is the warming at year 70 relative to the 1-10 years average.
- This suggests that the realized warming fraction (RWF), that is the TCR-to-ECS ratio, is higher in CNRM-ESM1 (0.50) compared to CNRM-ESM2-1 (0.35). Hence, the RWF as infered from CNRM-ESM2-1 resuls better agrees with the range of CMIP5 models.
![]() Future projections
Future projections
- Figure 5 provides a brief comparison of the future projections of the CMIP6 scenarioMIP emission pathways (O’Neill et al. 2016) and the corresponding CMIP5 future scenarios.
- This figure shows that CNRM-ESM2-1 simulates a global warming higher than CNRM-ESM1. It is even higher than the rcp8.5 likely range as assessed in IPCC AR5 (Kirtman et al., 2013).
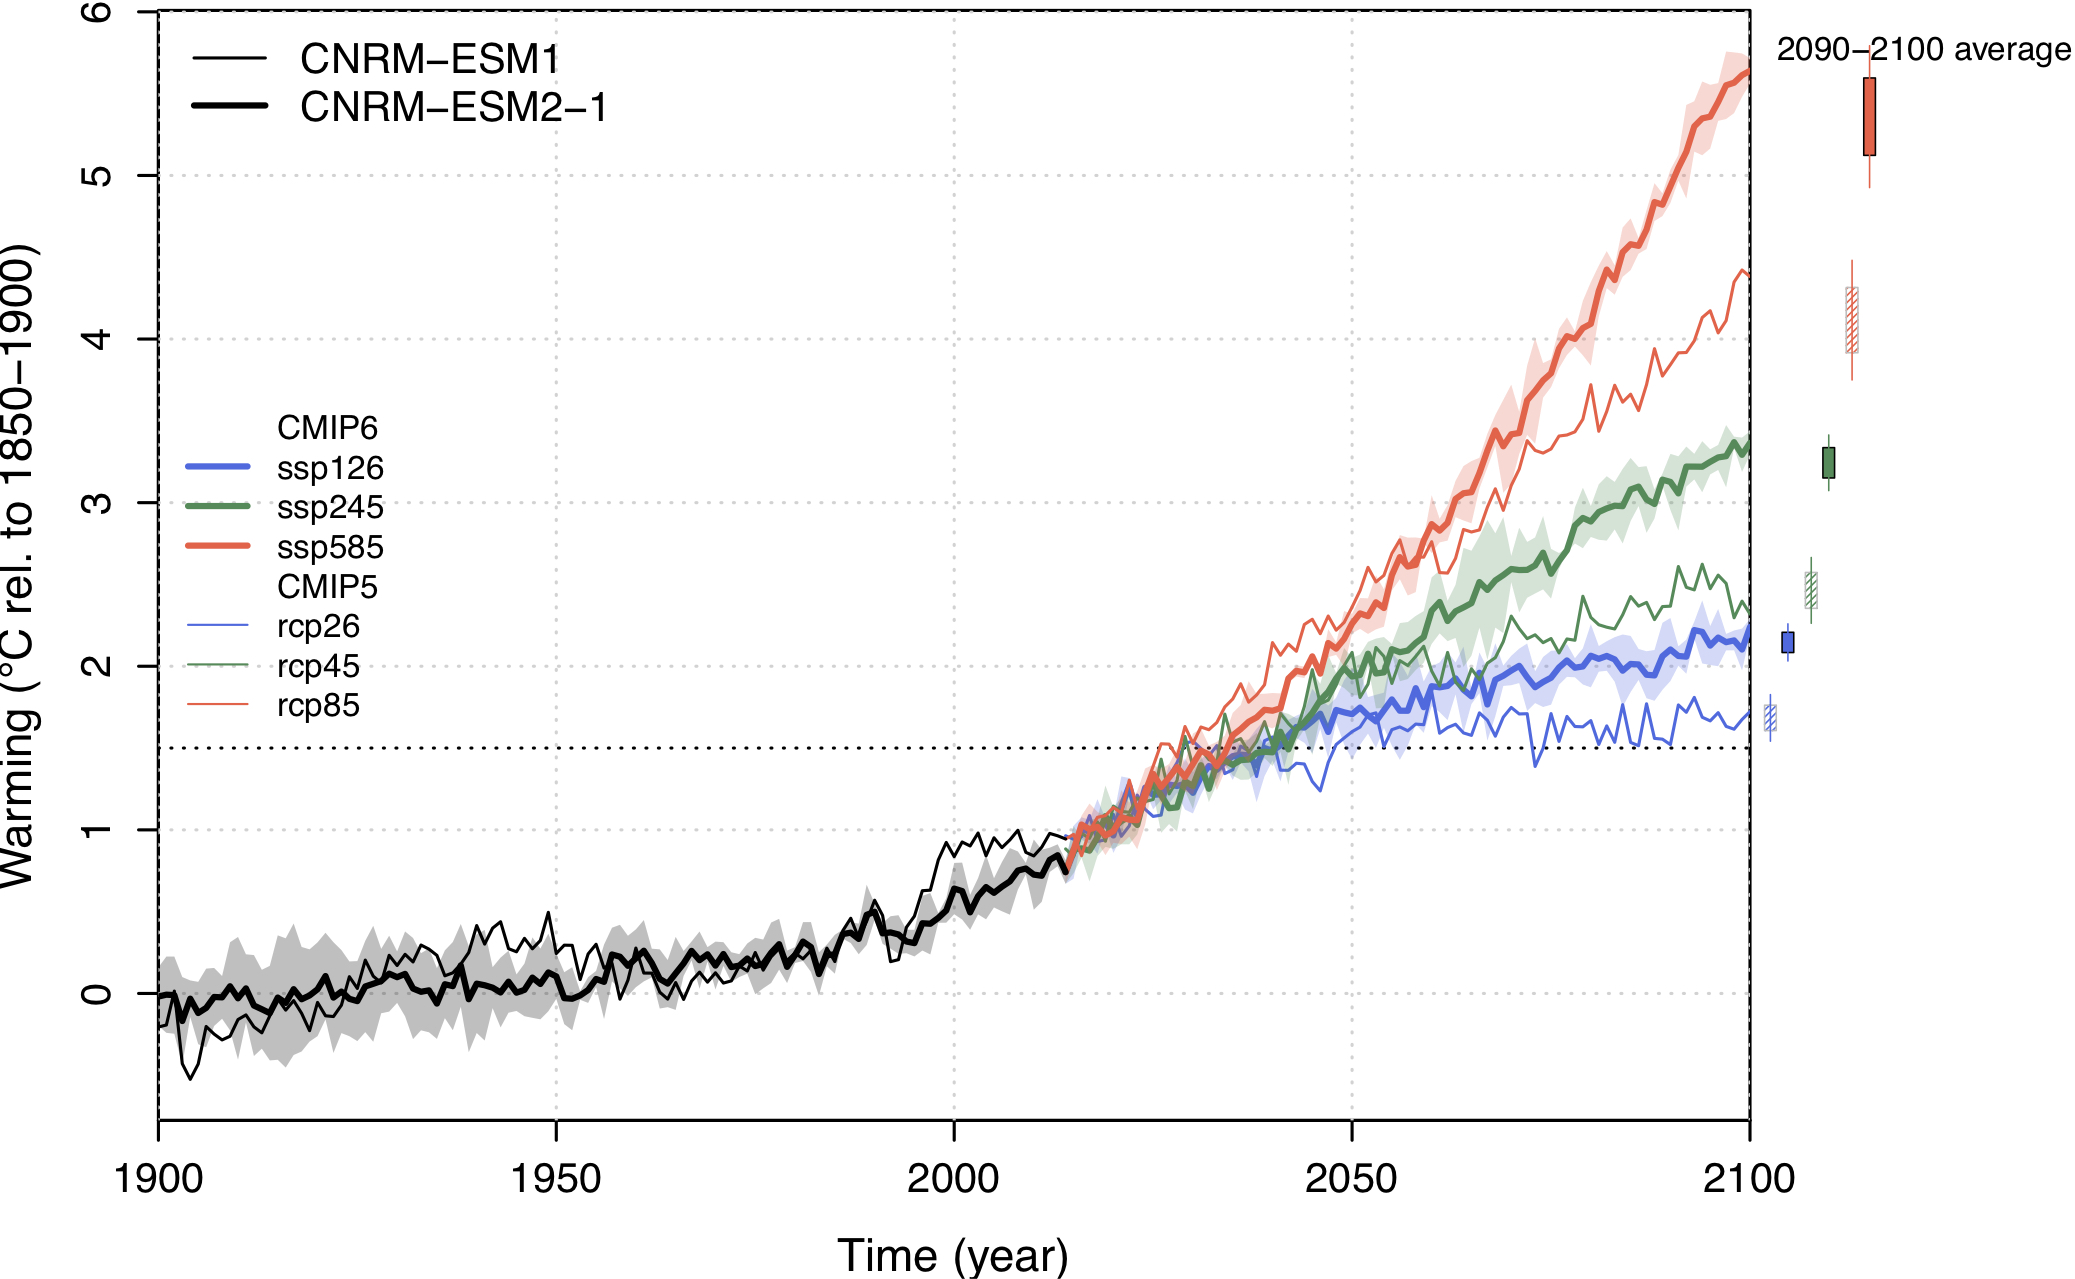
- Figure 5: Historical (1900-2014) and future projected (2014-2100) warming as simulated by CNRM-ESM1 (thin lines) and CNRM-ESM2-1 (bold lines) relative to 1850-1900 average. CNRM-ESM1 uses future projected from CMIP5, that is rcp26 (blue), rcp45 (green) and rcp85 (red). CNRM-ESM2-1 employs ScenarioMIP future projections in the context of CMIP6, that is ssp126 (blue), ssp45 (green) and ssp585 (red). Whisker-boxes on the right side panel highlight the difference of realized warming in 2090-2100 between CNRM-ESM1 (hatched box) and CNRM-ESM2-1 (filled boxes).
- As shown in O’Neill et al. (2016), the concentrations of atmospheric CO2 and the total radiative forcing (as infered from the climate emulator MAGICC) are roughly comparable between the ScenarioMIP shared socioeconomic pathways (ssp126, ssp245 and ssp585) and the CMIP5 representative concentration pathways (rcp26, rcp45 and rcp85).
- Therefore, difference in future projections mainly stems from inter-model specificities and represented feedbacks. Work is ongoing to understand the role of those feedbacks in future projections in CNRM-ESM2-1 and will be reported in the peer-reviewed literature in the coming year.
References:
- Gregory, J.M et al. (2004). A new method for diagnosing radiative forcing and climate sensitivity. Geophysical Res. Letts. 31 (3): L03205. doi:10.1029/2003GL018747
- Kirtman, B., S.B. Power, J.A. Adedoyin, G.J. Boer, R. Bojariu, I. Camilloni, F.J. Doblas-Reyes, A.M. Fiore, M. Kimoto, G.A. Meehl, M. Prather, A. Sarr, C. Schär, R. Sutton, G.J. van Oldenborgh, G. Vecchi and H.J. Wang, 2013: Near-term Climate Change: Projections and Predictability. In: Climate Change 2013: The Physical Science Basis. Contribution of Working Group I to the Fifth Assessment Report of the Intergovernmental Panel on Climate Change [Stocker, T.F., D. Qin, G.-K. Plattner, M. Tignor, S.K. Allen, J. Boschung, A. Nauels, Y. Xia, V. Bex and P.M. Midgley (eds.)]. Cambridge University Press, Cambridge, United Kingdom and New York, NY, USA.
- Knutti R, Rugenstein MAA, Hegerl GC (2017) Beyond equilibrium climate sensitivity. Nat Geosci 10:727–736. doi: 10.1038/ngeo3017
- Randall, D.A.; et al. (2007). 8.6.2 Interpreting the Range of Climate Sensitivity Estimates Among General Circulation Models, In: Climate Models and Their Evaluation. In Solomon, S. et al. Climate Change 2007: Synthesis Report. Contribution of Working Groups I, II and III to the Fourth Assessment Report of the Intergovernmental Panel on Climate Change.
- Séférian, R., Delire, C., Decharme, B., Voldoire, A., Salas y Melia, D., Chevallier, M., Saint-Martin, D., Aumont, O., Calvet, J.-C., Carrer, D., Douville, H., Franchistéguy, L., Joetzjer, E., and Sénési, S.: Development and evaluation of CNRM Earth system model – CNRM-ESM1, Geosci. Model Dev., 9, 1423-1453, https://doi.org/10.5194/gmd-9-1423-2016, 2016.
- Séférian, R. et al.: Evaluation of CNRM Earth-System model, CNRM-ESM2-1 : role of Earth system processes in present-day and future climate, Journal of Advances in Modeling Earth Systems, https://doi.org/10.1029/2019MS001791
- References of model components here