ALADIN developments during the second half of 2002
1. In Austria
A lot of work was devoted to the design of the new operational suite. See the report on operations and the two joint papers (plus one from the Vienna University).
2. In Belgium
Most efforts focused on ALATNET related research, and consequently are described in the ALATNET Newsletter.
Olivier Latinne finalized the study of the assimilation by optimal interpolation, using CANARI. The major conclusions of this are that the obtained surface analysed states are closer to the observations than those resulting from the interpolation of the global analysis, with an effect being felt on the ALADIN forecasts scores, up to 9 or 12 hours.
Then the migration on SGI started, as well as the operational implementation of the corresponding suite. This one will allow us, amongst other things, to supervise the correct operations of the Belgian automatic network stations. Still for the operational, we don't have yet carried out the transition towards AL15, since, along many comparisons of situations of strong precipitations, for August and September 2002, with the current operational version AL12, it appeared as very bad. Indeed the structure and the timing of the precipitations zones are changing in a direction which moves away from the observed reality. However when we change namelist setting to GCOMOD=0 , which correspond to the switch of the double dependency of parameterisation of the precipitation on resolution, the degradation is quite less.
The work of Piet Termonia, on predicting peaks of air pollution by means of the ALADIN model, ended. A paper has been written and will be submitted for publication. During 2002, this method became operational to send warnings to the ministry of the environment of the Brussels Region.
As ALADIN coordinator (CSSI member), Luc Gerard prepared the annual report about the current status of the research in physics.
3. In Bulgaria
Research work was performed along stays in Bruxelles (Ilian Gospodinov), Prague (Lora Gaytandjieva) and Toulouse (Maria Rousseva) : see the corresponding reports.
4. In Croatia
Most of the work was devoted to the design of the new operational suite. See the report on operations and the joint paper.
5. In Czech Republic (RC-LACE report)
A. Central European Flood event
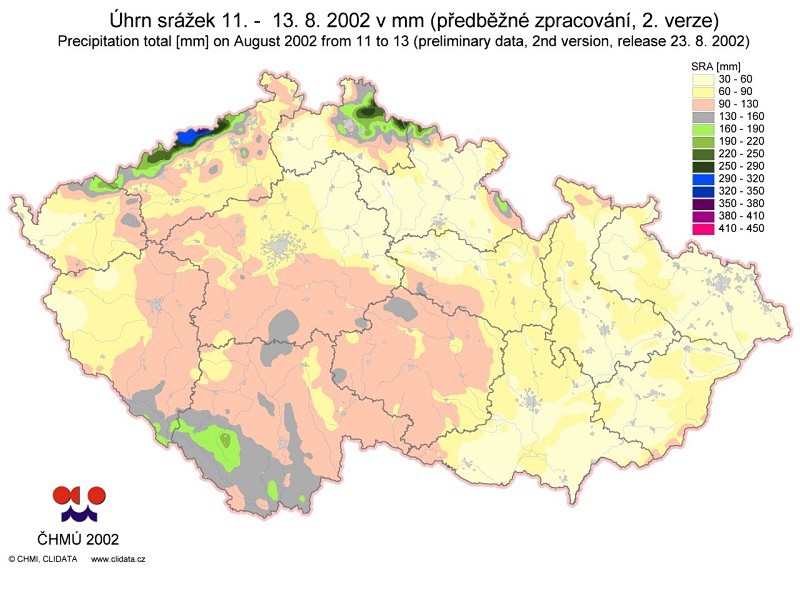
In August 2002 we witnessed a major flood in Central Europe, affecting namely Austria, Czech Republic and Germany. There were two periods of heavy rain, the first came on 6-7 August and the second on 11-13 August. In Czech Republic, the first heavy rain event caused floods on some rivers in the South of the country, but the dammages were still limited. The true catastrophe was caused by the second precipitation event, when the soil was already saturated from previous rain. Most of the precipitation fell in the catchement of the Vltava river, as it can be seen on Figure 1. Waters of the Vltava registered the historical flood in Prague (Figure 5). The Vltava flood wave then reached the Labe river (Elbe in German) and together with the contribution of other small rivers coming from the Krusne hory (Erzgebirge Mountains) it provoked a disaster in Germany, namely in Dresden.
Figure 1: Map of the observed precipitations from 11 to 13 August 2002. It includes also the detailed observations from the climatological network.
From what was said above, it is clear that a good forecast of the second rain period (11-13 August) was crucial. Unfortunatly the medium range forecast, which would have been quite valuable, was missed by global models, including ECMWF. A small indication of the well known “Genova bay cyclone scenario” was present in the global model forecast of DWD from 8 August 0 UTC but this signal was lost in the following forecasts. More correct picture of the precipitation event models provided with a lead time of 48 hours. Here ARPEGE and ALADIN provided an excellent forecast. In Czech Republic the performance of ALADIN Quantitative Precipitation Forecast (QPF) allowed to CHMI to provide timely warnings to the Central Crisis Management body and also locally to the Fire&Rescue Service operating centers at the regional level. Although the total dammages in Czech Republic are very high (more than 2 mld of Euros), the amount of lost lifes is remarkably low, certainly in comparison with the similar event in 1997.
The quality of the ALADIN QPF forecast may be illustrated by the comparison with respect to the professional synoptic stations (Figure 2). For the whole period of 11-13 August we have also cummulated the 12 hour precipitation amounts for the consecutive ALADIN forecasts in order to get a pattern comparable with the map of observed preciptation (Figure 3). This event became of course our reference case and we have tested on it the recent version of CYCORA TER +++ (now operational). The results may be seen on Figure 4: by a simple pattern comparison we may see that there are not significant differences, a bit better distribution of rain can be seen in Moravia. Finally, the ALADIN/LACE operational results were presented at the special SRNWP workshop on the Central European Flood Event associated to the EWGLAM meeting in De Bilt, Netherlands, October 2002. We may say that compared to the results obtained by other European NWP models for the forecast ranges up to 48 hours, ARPEGE/ALADIN system was the best both in amplitude and localisation of precipitations.
Figure 2: Verification of the ALADIN/LACE operational QPF 24 hours amounts. It is an average picture of comparison to all the professional synoptic stations in Czech Republic.
Figure 3: The cumulated ALADIN/LACE operational QPF for 3 days (11, 12 and 13 August 2002). The sum is constructed from the 12 hours QPF amounts from the consecutive forecasts: it starts with the forecast based on 10 August 12 UTC and the amount is taken in the interval P12 - P24, the following forecast is the one based on 11 August 00 UTC taking again P12 - P24 interval and so on. The resulting map may be compared to the observations on Figure 1, although the colour scale intervals are not the same.
Figure 4: The same QPF map like on Figure 3, but obtained with the test of CYCORA-ter+++ settings.
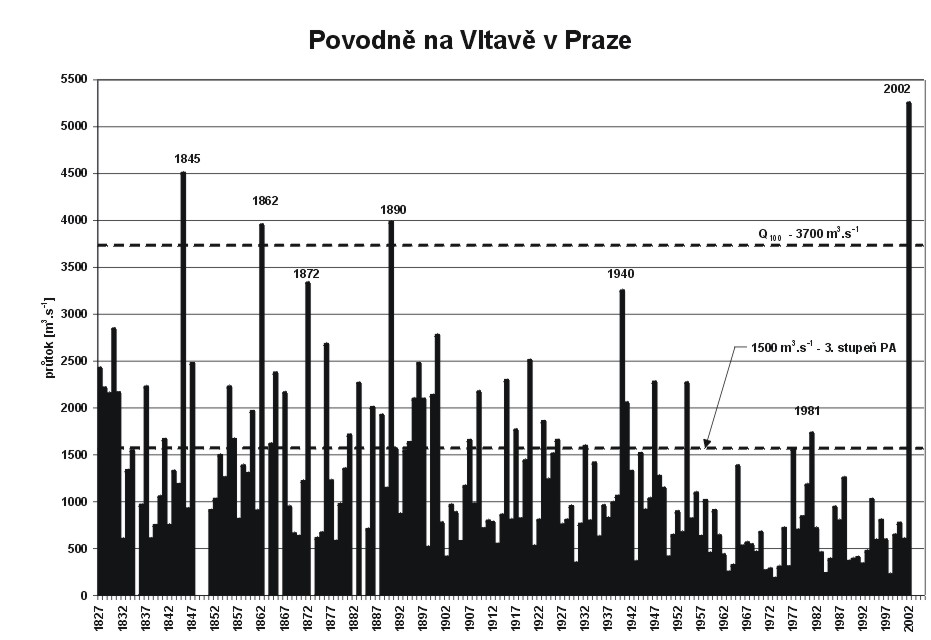
Figure 5: History of floods on the Vltava river in Prague. The water flux in cubic meters per second is drawn on the y-axis. There are denoted two limits by a dashed line: the first one is the flux of 1500 m3/s corresponding to the third level of flood warning: danger; the second one is the flux of 3700 m3/s corresponding to the so-called 100 years waters (it occurs statistically once per 100 years). We can see that the last "100 years flood" was in Prague in 1890. The normal water flux of the Vltava is 150 m3/s in Prague. The flood in 2002 was historical.
B. Research and developments
Note: all ALATNET related R & D, representing the majority of the effort, is reported in ALATNET Newsletter. Here we sum-up topics which are not referred as ALATNET ones for Prague centre.
Tuning of the background error variances for surface analysis (S. Ivatek - Sahdan)
The model errors were analysed for the ALADIN/LACE model in comparison with SYNOP measurements. The errors were computed as differences between ALADIN/LACE guess entering the blending procedure and the screen level observations. Then the statistics were computed in gridpoint space using 28 classes dependent on the distance between gridpoints and on the variances. It was also checked whether to use Gaussian or exponential correlation function: like in ARPEGE, the exponential function seems better. The statistics was computed on results for four network times (00, 06, 12 and 18 UTC), for a period from November 2001 to October 2002. New radius and ratios of s b to so were obtained to be used in surface CANARI analysis.
6. In France
Note : Only non-ALATNET work is reported here. And part of the effort of the Toulouse team was dedicated to purely ARPEGE (4d-var) problems (stretching and incrementality, new management of observations) during the present period.
Embassy fundings for Central and Eastern Europe (for 2001 and 2002) were not yet available, but many stays were organized during the last 4 months of 2002 (on "maintenance" fundings or bilateral support for Morocco and Tunisia), and the few left offices were full.
A large part of the work aimed at the creation and validation of a new library, cycle 25T2, with the help of Jan Masek, Chantal Moussy, Zahra Sahlaoui, Christopher Smith, Petra Smolikova and distant support from Jozef Vivoda. Its contents are described in the present Newsletter, in section 7 of the "ALADIN and ALATNET News" part. Besides Stjepan Ivatek-Sahdan introduced in the CANARI code the spatial smoothing of soil moisture (more precisely of the soil wetness index), which was performed externally in the previous tests. There are still some problems with ALADIN (when more than 1 processor is used).
Jean-Daniel Gril updated several ALADIN tools (PALADIN , CHAGAL, EGGX, ...) and started with new ones : DOMOLALO to design an ALADIN domain from lat×lon coordinates, and CONEO for conversions between the old and new versions of EGGX (not yet ready).
Another important part of maintenance, documentation, was also addressed, fostered by the workshop on maintenance in Budapest. Up-to-date documentations on the "direct-code" architecture, Full-Pos, 3d-var (and other variational configurations), CANARI, PALADIN, are now available thanks to Ryad El Khatib, Claude Fischer, Françoise Taillefer and Jean-Daniel Gril. See the first part of the Newsletter.
Work on configuration 923 restarted. Jadwiga Woyciechowska started to gather available papers and study the code, in order to write a detailed documentation. Khoudhir Tounsi focused on the input physiographic databases, making some more documentation available on the archive, testing and documenting associated tools. He also tried to introduce a local smoothing in the procedure previously designed by Neva Pristov and Mehdi Elabed to merge low- and high-resolution informations on orography. Outside the area of dense information, the resulting fields were "step-like", which is likely to provide unrealistic derived fields and even make the model blow up at very high resolution (below 3 km, i.e. when reaching that of global databases). To end with, Dominique Giard updated the code to make it work with cycles AL12 (shared- and distributed-memory versions) and AL15, with the same output. However, spectral orography was shown to be sensitive to compilation options, through the minimization process. The problem of ALADIN domains with hardly any water (or similarly land) points was solved. Work will go on in 2003 (further phasing, introduction of new developments, documentation).
Françoise Taillefer addressed the improvement of sea-ice description within SST analysis. First, albedo and emissivity over sea are now updated at each analysis step, considering the "effective" sea-ice limit (according to surface temperature). Second, the sea-ice limit will be improved using SSM/I observations. The underlying code modifications are ready.
Agnesz Mika investigated two problems in the assimilation of soil and surface fields, on simple analysis experiments (to start). First she analysed the impact of coastal observations. These may lead to a local spurious moistening of soil for the corresponding observed 2m fields are not representative of the neighbouring land points. Simply excluding such observations is likely to improve the situation, as shown by comparisons performed on a summer and a winter cases. The impact is stronger in summer, when conditions for soil moisture correction are more often met. Figures 1a-d illustrate how spurious changes may be avoided.
 (a)
(a)
 (b)
(b)
 (c)
(c)
 (d)
(d)
Figures 1
(a) Soil wetness index (SWI) for the first guess : one may notice very wet or dry zones along the coasts
(b) Difference in corrections for the soil wetness index : excluding coastal observations (experimental analysis) induces changes in the right direction, consistently with the changes in analyzed 2m fields (see below).
(c) Difference in the corresponding analysis increments for 2m temperature
(d) Difference in the corresponding analysis increments for 2m relative humidity
Second she tried to estimate the impact of performing surface and upperair analyses simultaneously in ARPEGE. Operationally surface analysis and hence soil moisture/temperature assimilation use as input analysed upperair fields. Historically this aimed at preventing soil moisture corrections from forecast failures intrinsic to upperair fields, based on some experimented problems. However this was not quite satisfactory, especially since the implementation of 4d-var, for the balance between the surface and the lowest model levels is lost, 2m observations cannot be used in upperair assimilation, and it induces some delay in operations. The potential combinations may be illustrated by the tables hereafter. The question is valid for ALADIN too. The impact of such a modification on analysed 2m fields (temperature and relative humidity) was computed and compared to the corresponding operational analysis increments on 8 situations covering the full annual cycle. Relative changes are generally very small : less than 6 % (12 % in summer) for about half of the land points, and significant (of the same order of magnitude than analysis increments) for less than 0.36 % of land points (0.77 % in summer).
Table 1 : Combinations with 3d-var upperair analysis (or O.I. or blending)
assimilation step / time |
-6h |
0h |
+6h | |
initial 6h forecast |
X0(-6) / S 0(-6) |
X0( 0) / S 0( 0) |
||
input to 3d-var |
X0( 0) / S 0( 0) |
|||
oper |
output of 3d-var |
X1( 0) / S 0( 0) |
||
input of surface analysis |
X1( 0) / S 0( 0) |
|||
output of surface analysis |
X1( 0) / S 2( 0) |
|||
input to 3d-var |
X0( 0) / S 0( 0) |
|||
test |
output of 3d-var |
X1( 0) / S 0( 0) |
||
input of surface analysis |
X0( 0) / S0( 0) |
|||
output of surface analysis |
X0( 0) / S 2( 0) |
|||
input of surface analysis |
X0( 0) / S0( 0) |
|||
or ? |
output of surface analysis |
X0( 0) / S 2( 0) |
||
input to 3d-var |
X0( 0) / S2( 0) |
|||
output of 3d-var |
X1( 0) / S2 ( 0) |
|||
subsequent 6h forecast |
X1( 0) / S 2( 0) |
X3( 0) / S 3( 0) | ||
Indices 1 and 2 for upperair and surface analyses changes respectively. The basic differences with the (old) operational version are in bold characters.
Table 2 : Combinations with 4d-var upperair analysis
|
assimilation step / time |
-6h |
-3h |
0h |
+3h |
|
initial 6h forecast and |
X0(-6) / S 0(-6) |
X0(-3) / S 0(-3) |
X0( 0) / S 0( 0) |
|
|
first outer loop of 4d-var |
X0(-3) / S 0(-3) |
X0( 0) / S 0( 0) |
X0(+3) / S 0(+3) | |
|
final outer loop of 4d-var |
X1(-3) / S 0(-3) |
X1( 0) / S 1(0) |
X1(+3) / S 1(+3) | |
|
input of surface analysis (oper) |
X1( 0) / S0( 0) |
|||
|
input of surface analysis (test) |
X0( 0) / S0( 0) |
|||
|
subsequent 6h forecast |
X1( 0) / S 2( 0) |
X3(+3) / S 3(+3) |
Indices 1 and 2 for upperair and surface analyses changes respectively. One important impact of the move to 4d-var is that the analysed upperair fields are balanced with gridpoint fields modified by the internal forecasts, which may differ from the initial 6h first guess.
Table 3 : Ratio of the difference between the 2 experiments to the operational analysis increment, for 2m temperature and 2 situations : a)10/02/2002, b) 05/08/2002 (histogram for land points, over the whole globe, i.e. 59015 points)
limits |
0. |
1/32 |
1/16 |
1/8 |
0.25 |
0.50 |
0.75 |
1.0 |
1.5 |
2.0 |
2.5 |
3.0 |
3.5 |
4.0 |
4.5 |
5.0 |
5.5 |
6.0 |
6.5 |
7.0 |
> |
a |
24078 |
10344 |
8757 |
5688 |
2795 |
764 |
316 |
183 |
59 |
26 |
17 |
8 |
0 |
0 |
1 |
0 |
1 |
0 |
0 |
0 |
0 |
b |
17072 |
10094 |
10296 |
7548 |
3884 |
938 |
405 |
279 |
57 |
28 |
13 |
4 |
2 |
2 |
3 |
0 |
0 |
0 |
0 |
1 |
0 |
7. In Hungary
Most of the activities performed in Budapest around the ALADIN model are either directly related to the operational model version (see our report at that section) or related to the ALATNET project (see ALATNET part of the Newsletter), hereafter those activities are listed briefly which are not falling into these above mentioned categories.
Very important event of the second half of 2002 was the organisation of the ALADIN maintenance and phasing training workshop held in Budapest at the last week of November (the summary of the final discussions of the workshop can be found elsewhere in this Newsletter). All the information together with the powerpoint presentations and postscript documents are available on the homepage of our Service (please consult the following internet address :
http://omsz.met.hu/ismeretterjesztes/rendezvenyek/aladin_ws/prog.html )
Other important initiative was the preparations for building a team and necessary infrastructure for efficient participation on the LAM-EPS (Limited Area Models Ensemble Prediction System) project of the SRNWP network. A working plan was written and accepted (which is under discussion with the Météo-France LAM EPS experts) and it was ensured that from the summer 2003 two students just finishing the university will join the team in order to be active in this important field of interest. After consultation with Météo-France we have contacted the SRNWP coordinator (Jean Quiby) and we have expressed our wish and intention to be the lead centre of this SRNWP project (unfortunately despite of several e-mails we didn't get any answer until the deadline of this Newsletter).
A new homepage of the Department of Research and Development was created, where the activities of the NWP group is detailed (please visit http://omsz.met.hu/english/kfo/neo_en.html).
8. In Moldova
Nothing new.
9. In Morocco
Most of the work was devoted to the implementation of the new operational suites, and the investigation of various problems (with observation management, use of OpenMP, etc ...). See the report on operations.
10. In Poland
See the report on "Operations".
11. In Portugal
See the report on "Operations".
12. In Romania
Implementation of a new operational suite with shared tasks between SUN E4500 and ALPHA DEC platforms (Cornel Soci)
The main idea of the new NWP operational suite was to share tasks between two workstations. While the ALADIN model integration is carried out on a SUN E4500 platform, as soon as a historical file becomes available, it is transfered on a DEC 500 workstation where all the post processing tasks, such as creating grib files, pseudo satellite images, meteograms etc. are performed. The results of the new and old operational suites have been compared for two weeks.
Verification of the ALADIN results including statistical adaptation (Otilia Diaconu)
(A very interesting presentation about tools and needs was also prepared for the Assembly of Partners.)
Preparation of the CANARI presentation for the phasing and maintenance training workshop held in Budapest, 2002, 25-29 November. (Cornel Soci)
The power point form of the presentation can be found at :
Organization and participation to the 7th Assembly of the Aladin Partners (Bucharest, 28th of October, 2002)
13. In Slovakia
See the report on operations.
14. In Slovenia
Verification
The main activity in Slovenia was the development of the prototype ALADIN verification project. More information about the concept of the project is available at :
http://www.cnrm.meteo.fr/aladin/concept/verification/verif.html
The working prototype has been developed and presented at 7th Assembly of ALADIN partners in Bucharest. The application consists of : a data extraction part from the model outputs (the so-called filter), a database for the storage of extracted model data and observations and a web application for on-line retrieval of results. The prototype is quasi-operational in Slovenia since August 2002. However, quite significant work has to be invested before operational use also in other ALADIN centres will be possible.
Croatia contributed to this project, with the working visit of Lovro Kalin to Ljubljana (1 week stay). It is planned to continue this collaboration.
Developments for operational activities
The main working subject in November and December was the installation of the new computer, the porting of ALADIN cycles 12, 15 and 25T1 to the new machine and the preparation of a redesigned operational suite.
Contributions to the Budapest training course on maintenance
Jure Jerman and Neva Pristov prepared lectures about OpenMP, debugging, optimization, E923, ...
15. In Tunisia
Computing system for ALADIN : the best news.
Getting the best news they have never got since they integrated the ALADIN consortium, the ALADIN/Tunisie team had spent a happy new year 2003 when learning finally the agreement between INM and the IBM company to purchase the required computer.
The expected machine is an IBM pSeries 690 (8 processors POWER4, 35 GFlops, 16 GB RAM, 280 GB HD). The installation of that machine locally will start during the week of March 17th, 2003. The implementation of the whole ALADIN/Tunisie suite should be starting by the last week of April 2003.
Verification
Some tests have been made in order to downscale some extracted ALADIN/Tunisie outputs. Even if these tests are not yet achieved, the first results seem to be similar to those obtained using the classical multi-linear downscaling. We decided therefore to maintain for a while the downscaling of ARPEGE temperature field.
Miscellaneous items
· The set up of a new local web site for ALADIN which contains mainly:
- The most extracted fields from ALADIN/Tunisie outputs, under a convivial interface easily consultable for the benefit of the forecasters. That interface will replace the postscript gmeta file produced by CHAGAL .
- The results of the daily objective control of ALADIN/Tunisie outputs.
- The ALADIN/Tunisie news, the reports and bibliography of the ALADIN team.
· Optimization of the script which repatriate the post-processed ALADIN/Tunisie outputs from the delage machine in Toulouse.
Since the installation of the new procedure we have regularly got the ALADIN/Tunisie files correctly.